2020
2(62)
DOI: 10.37190/arc200205
Purpose of research
El Fuerte de Samaipata is a pre-Hispanic archaeological
site on the eastern slopes of the Andes at an altitude of ca.
1890–1925 m. Due to its historical and cultural value, the
site was placed on the UNESCO World Heritage List in
1998. The entire archaeological site covers about 40 hec-
tares and consists of two main parts: an administrative and
ceremonial complex in the southern part of the site, and
a natural rock (ca. 80 × 250 m) in the northern part of the
site. The rock was the main subject of the project “Archi-
tectural examination and complex documentation of Sa-
maipata (Fuerte de Samaipata/Bolivia) site from the World
Heritage List”
1
. The research presented here is part of this
larger project.
Due to the rapid erosion of the rock, one of its main
objectives of the project was to produce comprehensive
documentation of the entire sacred rock with the highest
possible degree of accuracy and detail.
The proper selection of technology, equipment, soft-
ware, and workow was fundamental to the success of the
* ORCID: 0000-0003-0623-8071. Faculty of Architecture,
Wro cław University of Science and Technology, e-mail: jacek.kosciuk@
pwr.edu.pl
** ORCID: 0000-0002-1035-3905. Faculty of Architecture,
Wrocław University of Science and Technology.
*** ORCID: 0000-0002-1100-642X. Faculty of Architecture,
Wrocław University of Science and Technology.
**** ORCID: 0000-0001-5442-3947. Faculty of Architecture,
Wrocław University of Science and Technology.
1
Cf. J. Kościuk, M. Ziółkowski, B. Ćmielewski, D. Ulloa Vi-
daurre, Samaipata project – aim of the research, methodology, and meth-
ods of documentation, in the same issue of “Architectus”.
Jacek Kościuk*, Bartłomiej Ćmielewski**,
Małgorzata Telesińska***, Anna Kubicka****
3D terrestrial laser scanning of El Fuerte de Samaipata
Naziemne laserowe skanowanie 3D El Fuerte de Samaipata
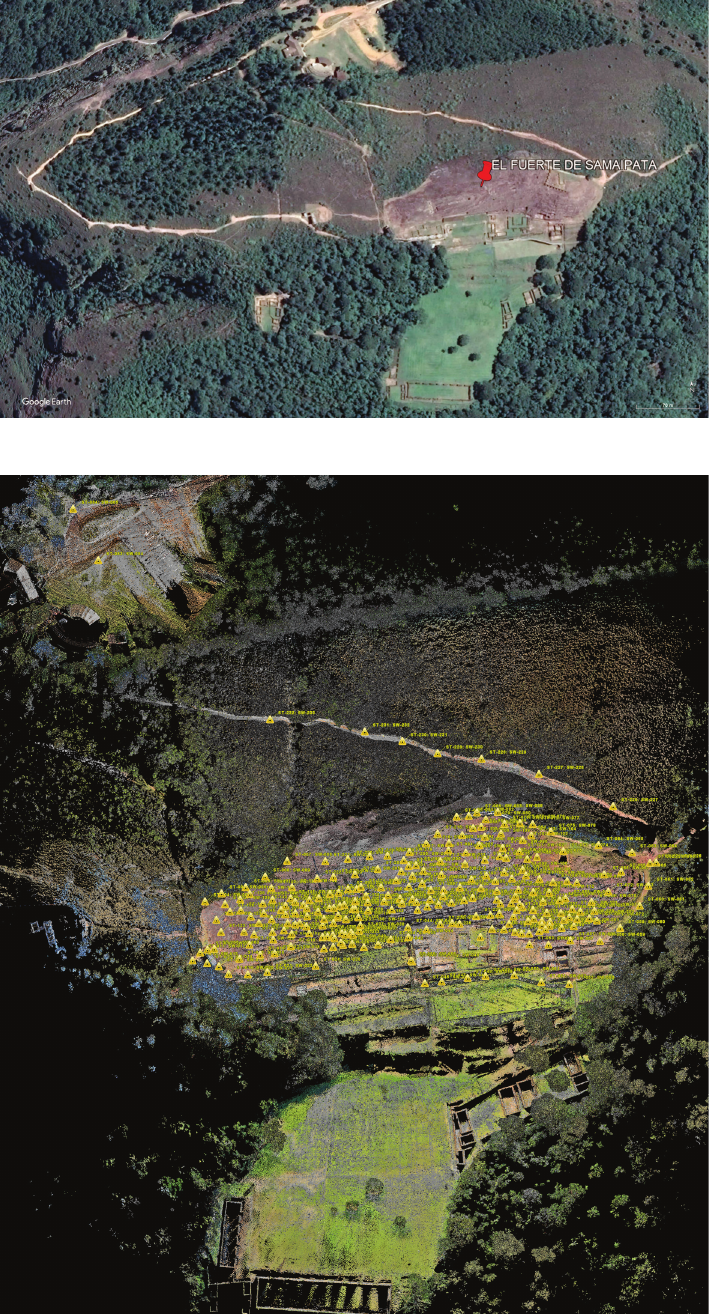
entire project. Due to the scale of the entire site (the Sa-
maipata rock itself measures 80 × 240 m, while the entire
site is ca. 400 × 500 m; Fig. 1) and the required data den-
sity (not worse than 3 × 3 mm on average), 3D TLS was
the rst choice of technology for the project, especially
since by that time (2016), the 3D Scanning and Modeling
Laboratory (LabScan3D), which was involved in the proj-
ect, had already been familiar with this technology for over
ten years [1]. In the last decade, TLS has become a widely
used method in the documentation of architectural and ar-
chaeological monuments [2]–[4], generally favoured over
traditional and other documentation methods [5], [6]. It has
also been successfully used in projects similar to ours [7].
Method, equipment, software,
and general workflow
TLS has been used extensively for heritage documen-
tation in the last several years. This technique creates pre-
cise 2D documentation as well as a high-resolution and
high-quality 3D models. The point clouds obtained are im-
portant data sources. Within a specic distance, TLS mea-
sures the 3D spatial information of the surroundings using
a laser distance meter and a high resolution protractor for
horizontal and vertical angles [8], [9]. This method can
quickly acquire the geometry of a large area with an accu-
racy of millimetres since the quality and rate of data acqui-
sition for TLS is very high. A similar use of TLS on large-
scale stone engraved monument, was conducted in 2008
by a Chinese team [10] on the World Heritage Yungang
Grottoes, which were seriously destroyed by wind erosion.
Another example of a place where TLS was used is Çatal-
höyük, a nine-thousand-year-old Neolithic city [11] where
28 Jacek Kościuk, Bartłomiej Ćmielewski, Małgorzata Telesińska, Anna Kubicka
Fig. 1. The El Fuerte de Samaipata
site on GoogleEarth ©.
Satellite image taken on 05.03.2018
[accessed: 12.07.2019]
Fig. 2. Distribution of scanner
stations for the TLS
of El Fuerte de Samaipata
(elaborated by J. Kościuk)
the state of its preservation was monitored during sever-
al surveying epochs. 3D scanning and modeling has also
been used for the documentation, preservation, and resto-
ration of other cultural heritage objects and historical sites
[12]–[14]. TLS is even mentioned by UNESCO in their
guidelines for World Heritage Sites management [15].
3DterrestriallaserscanningofElFuertedeSamaipata / Naziemnelaseroweskanowanie3DElFuertedeSamaipata 29
A Leica ScanStation P40 scanner was used for this
project. Its technical specication guaranteed one of the
highest accuracies available in 2016 – a range accuracy
of ±1.2 mm + 10 ppm over full 270 m range; 3D position
accuracy of 3 mm at 50 m and 6 mm at 100 m; range noise
of 0.4 mm RMS at 10 m and 0.5 mm RMS at 50 m, both
at 78% albedo; and 2 mm standard deviation at 50 m. In
total, 278 scanner stations were placed over the entire hill
(Fig. 2). Each station covered a horizontal range of 360°
with a resolution of 3 mm at 20 m. This assured proper over-
lapping of scans and appropriate density of recorded data.
Despite the technical characteristics, scanning the Sa-
maipata rock was challenging as we could not x any
points directly onto the rock. This forced us to establish
a network of xed reference points in adjacent areas. Most
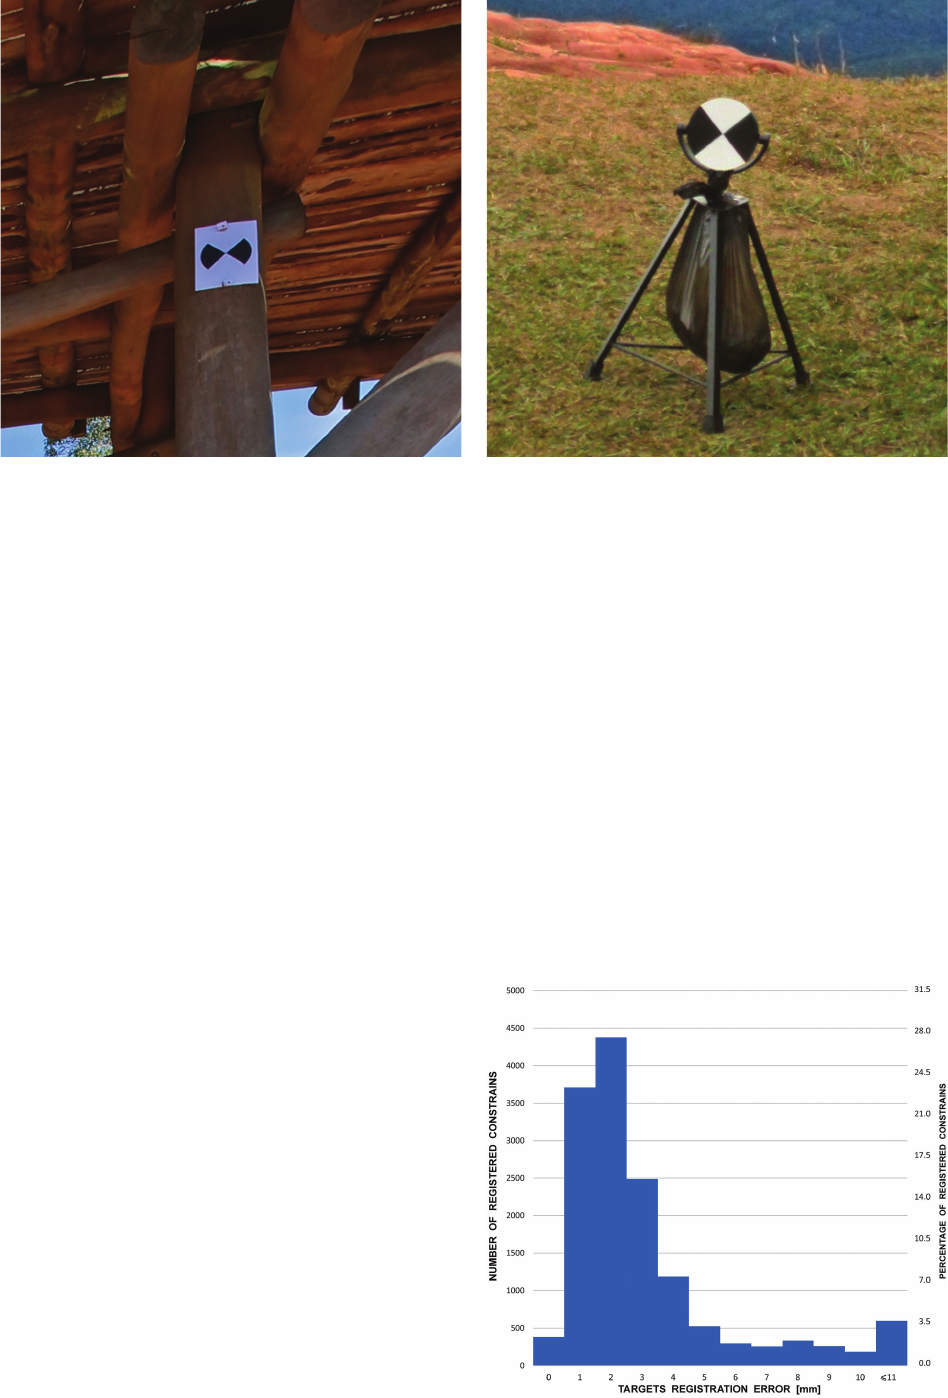
of the points were attached to the platforms for visitors
surrounding the rock. For this purpose, we used black and
white (B & W) targets printed on a plastic, weather resis-
tant material (Fig. 3).
Platforms for visitors, however, did not surround Sa-
maipata rock from all sides, and in addition, the distance
from the top of the hill to the nearest printed B & W target
often exceeded 50 m, making their precise locations on
the 3D scan unreliable. Six small tripods ordered from
a local blacksmith solved the problem (Fig. 4). Leica HDS
targets were placed on the tripods and moved alongside
subsequent scanner stations.
The targets were used to tie individual scanner posi-
tions together in a local coordinate system. As far as pos-
sible, the principle was that from each scanner position,
a minimum of two Leica HDS targets and two printed
B & W targets should be visible. Considering that thanks to
the dual-axis compensator the scanner was always aligned
vertically, this guaranteed sucient data redundancy for
each scanner station and allowed errors in referencing
each of the targets to be calculated. In total, over 14.5
thousand constraints were used for the nal registration of
Fig. 3. Printed B & W target (photo by J. Kościuk) Fig. 4. Leica HDS target on a tripod (photo by J. Kościuk)
Fig. 5. Distribution of errors in target registration (elaborated by J. Kościuk)
all scanner stations in local coordinates. The error distri-
bution for all constraints is shown in Figure 5.
The mean absolute error for constraints was 3 mm. The
biggest errors were on the printed B & W targets attached
to the platforms surrounding the rock, due to heavy vi-
brations caused by people walking. Very strong winds
also partially aected the small tripods for the Leica HDS
targets. Weighting was used for registration errors not ex-
ceeding 10 mm, and for larger errors, the constraint was
removed from calculations.
The referencing of all printed B & W targets to the com-
mon survey network was done with a Leica TCRP1203
Total Station. Its angular accuracy was of 3″ and the dis-
tance error was ±2 mm + 2 ppm. The device parameters
together with the measured angles and distances between
all pairs of mutually visible positions of the instrument
30 Jacek Kościuk, Bartłomiej Ćmielewski, Małgorzata Telesińska, Anna Kubicka
allowed the survey network to be aligned with an average
x, y point position square error equal to 6.8 mm and aver-
age height square error equal to 2.9 mm (Fig. 6).
The next step was to transform the local coordinates
to the global reference system using isometric transfor-
mation. The network coordinates were transformed to the
WGS 84/UTM zone 20S, EPSG:32720 coordinate system
by referencing four governmental surveying benchmarks
(points FS01, FS02, FS03, and FS04) found on the site.
Their coordinates were kindly supplied by ocials from
the Archaeological Research Centre in Samaipata.
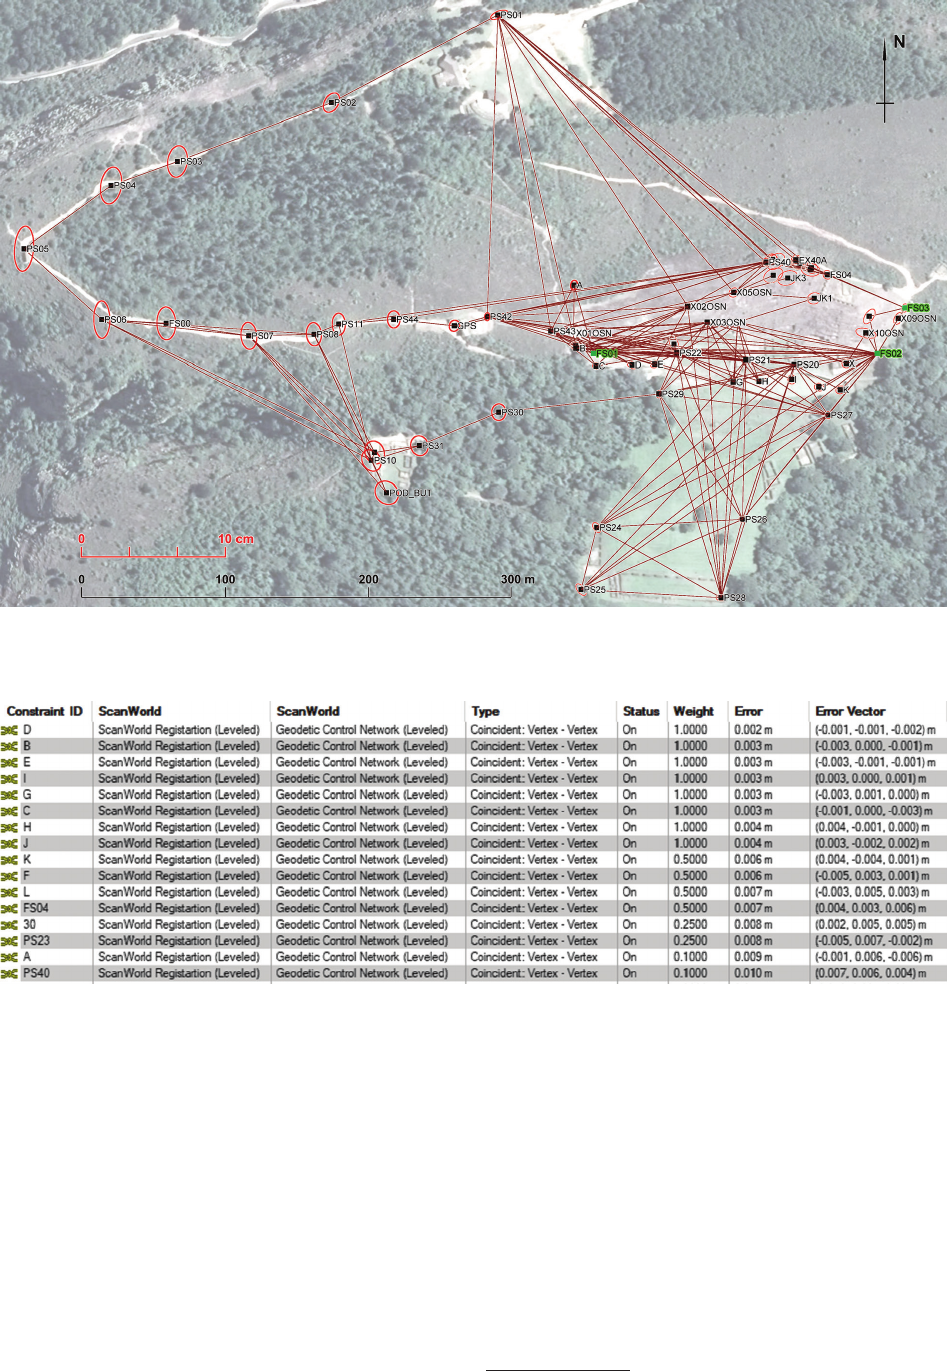
In the last step, the whole scanning project, which up to
this moment was in local coordinates, was registered into
the WGS 84 global positioning system (GPS). The glob-
al coordinates of 12 printed B & W targets, three govern-
mental surveying benchmarks, and one additional point
from the surveying network were used for the registration
(Fig. 7). Weighting was used again, in this case for errors
greater than 4 mm.
Obtaining colour information for each of the millions of
3D points was a separate problem. Gaining the most accu-
rate colour reproduction was, however, not our top priority.
This was instead solved by the photogrammetry sub-proj-
ect running in parallel with this one
2
. The main problem in
our project was time we need to spend on the eld.
2
Cf. B. Ćmielewski, I. Wilczyńska, C. Patrzałek, J. Kościuk, Digi-
tal close-range photogrammetry of El Fuerte de Samaipata, in the same
issue of “Architectus”.
Fig. 6. Survey network after adjustment. Error ellipses (in red) exaggerated (elaborated by B. Ćmielewski)
Fig. 7. Transformation errors for registering into UTM coordinate system. Screenshot from the Leica Cyclone (elaborated by B. Ćmielewski)
3DterrestriallaserscanningofElFuertedeSamaipata / Naziemnelaseroweskanowanie3DElFuertedeSamaipata 31
The Leica ScanStation P40 is equipped with an inter-
nal HDR RGB camera that takes photos at a resolution
of 4 megapixels for each 17° × 17° colour image. All 270
images are automatically converted into a panoramic im-
age with a resolution of up to 700 megapixels and mapped
as RGB values on a 3D point cloud. The time required
for this – over 7 min to shoot 270 images in our lighting
conditions and with medium resolution – was dicult to
accept. Due to the very capricious weather that we found
in Samaipata, the time needed in the eld was of funda-
mental importance to us, even at the price of extended data
post-processing time in the back oce.
For this reason, the internal RGB camera on the Lei-
ca ScanStation P40 was replaced with a Sony Alpha
STL-A65 camera with an APS-C sensor matrix of 24 me-
gapixels. The Sigma EX 10 mm sheye HSM lens f/2.8
was attached to the camera box, and everything was
mounted on the Nodal Ninja 3 MKII panoramic head
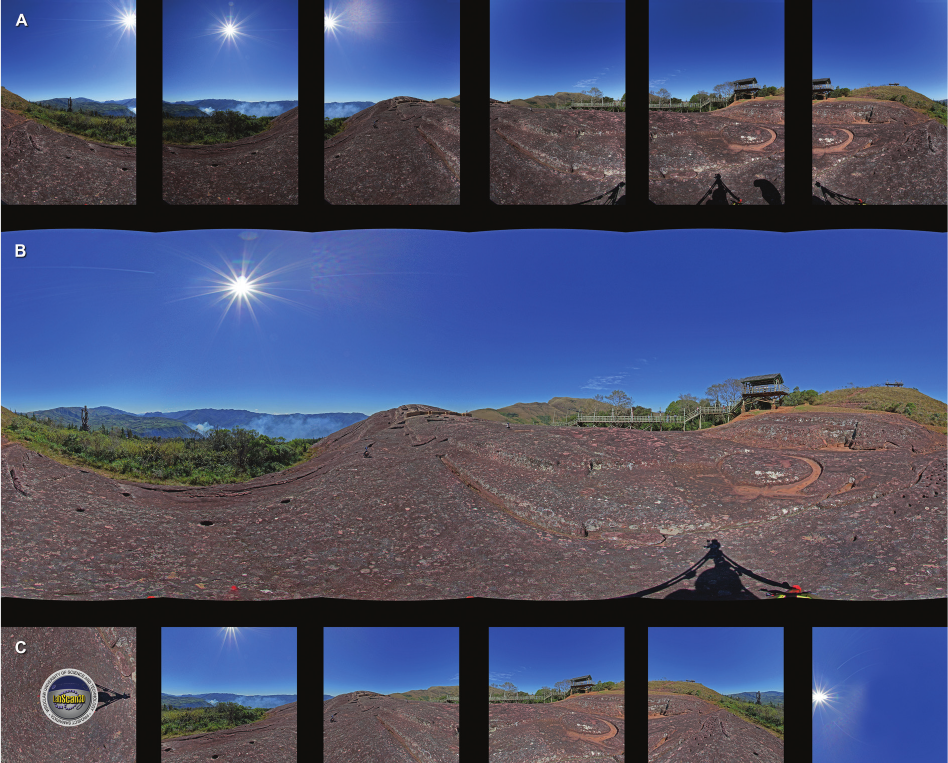
adjusted for 60° intervals. The camera was used in auto-
matic HDR mode, resulting in well balanced lights and
shadows on all the pictures (Fig. 8A). Compared to the
use of an internal camera, we saved about 5 min at each
scanner station.
The further workow required PTGui Pro (version
10.0.16) for stitching single images into an equirectangular
panorama (typically with a resolution of 107 megapixels),
and in the next step, image cubes (16 megapixels each)
were produced, to be ported into Leica Cyclone to map
RGB values on the 3D point cloud. The last step required
a time-consuming and tedious selection of analogous points
on the 3D cloud and each of the cubes. Fortunately for us,
the new version of Leica Cyclone Register launched just
after our return from the eld, and this greatly simplied the
process. Now it is enough to import the equirectangular pan-
orama to the Leica Cyclone Register module and the whole
process of mapping the RGB values on the 3D point cloud
is automatic. Colouring scans, registering and cleaning un-
wanted objects (moving people, tripods with Leica HDS
targets, dust particles in the air, etc.) ended in Autumn 2017.
Results and discussion
The resulting 3D point cloud well documents even the
most dicult parts of the rock – the at terrain on its ridge,
where it was hard to obtain an appropriate angle (>30
o
)
of incidence of the laser beam (Fig. 9).
Fig. 8. Acquisition of RGB values: A – HDR images; B – equirectangular panorama; C – image cubes ready to port to the Leica Cyclone
(elaborated by M. Telesińska)
32 Jacek Kościuk, Bartłomiej Ćmielewski, Małgorzata Telesińska, Anna Kubicka
For almost horizontal surfaces, the density of coverage
with measuring points was not worse than 3 × 3 mm. For
slopes, where the angle of incidence of the laser beam was
more favourable, the density of the 3D point cloud was
usually better than 2 × 2 mm.
It was also possible to capture small dierences, hardly
exceeding 1 cm in depth, of the rock relief. Thanks to this,
Fig. 9. Fragment of 3D point cloud. The so-called “Great Snake” petroglyph on the top of the Samaipata rock:
A – RGB textured 3D point cloud; B – 3D point cloud represented in intensity reflection values (grey scale) (elaborated by J. Kościuk)
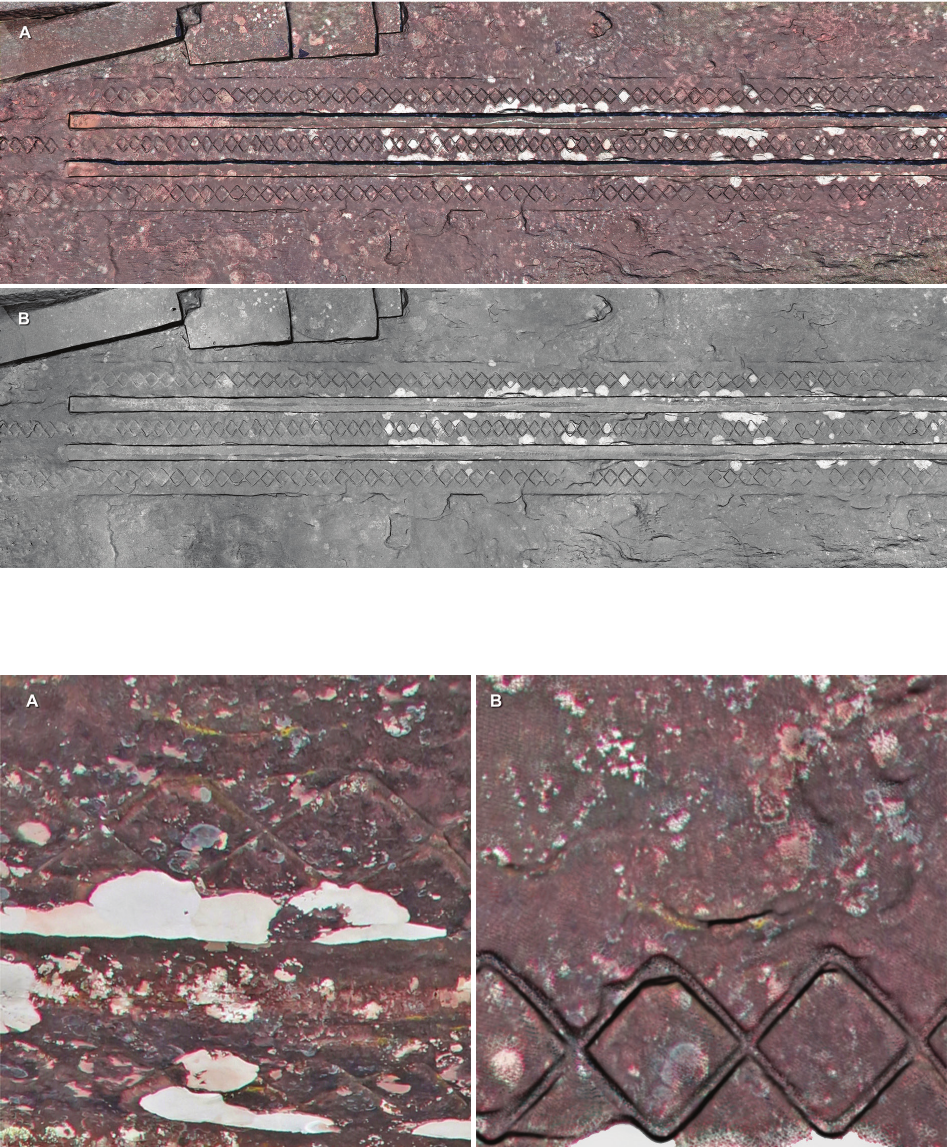
Fig. 10. Detail of the so-called “Great Snake” petroglyph on the top of the Samaipata rock:
A – fragment of the petroglyph as photographed on the field (photo by J. Kościuk);
B – the same fragment as RGB textured 3D point cloud with hill-shading algorithm (elaborated by J. Kościuk)
blurred portions of petroglyphs, unclear on the eld in
natural lighting (Fig. 10A), became clearly visible in the
shaded 3D cloud image (Fig. 10B). The latter is an ortho-
image derived from 3D scans from 68 scanning stations
– some distant by more than 50 m. The points overload-
ed with reection intensity were ltered and the “Cloud
Shaded” algorithm available in Leica Cyclone was used.
3DterrestriallaserscanningofElFuertedeSamaipata / Naziemnelaseroweskanowanie3DElFuertedeSamaipata 33
The whole picture was rened by applying a negative
version of the black and white image obtained from the
“Cloud Silhouette” algorithm.
It is noteworthy that the colour reproduction on the 3D
point cloud turned out to be close to the colours obtained
on uncalibrated digital photos from the eld (compare
Figs. 10A, B).
Conclusions and project limitations
The chosen method of documentation turned out to be
adequate for its purpose of providing the most accurate
reproduction of the surface of the Samaipata rock includ-
ing its smallest details. However, the resulting database
is so large (265 GB) that it requires computers with high
computing power, high-speed graphics cards, and a large
amount of RAM to operate it. We had an acceptable level
of work comfort when using a computer with two Xeon
processors (Intel
®
Xeon
®
CPU E5-2630 v2), 128 GB RAM,
and two NVIDIA GTX 1070 graphics cards.
The practical use of such a large and detailed scan da-
tabase brings problems. Assuming that the scanned area
measures only 80 × 240 m with an average scanning den-
sity of 3 × 3 mm, and assuming that the intention is to get
a full graphical representation of the entire area, we will
end up with a le size of 24 000 by 72 000 pixels (1728
megapixels). Using les of this size on a daily basis is not
convenient. However, this was not the purpose of scan-
ning with such a high density. The main value of this scan
database is that of a document that is a detailed (as far as
today’s technical possibilities permit) representation of the
state of the monument at a specic moment (July 2016).
In the next ten years it would be advisable to repeat,
if not a scan of the whole rock, then at least a scan of its
most important fragments. Comparison of data from the
two dierent periods would determine the speed of erosion
and indicate the places most exposed to it. The use of TLS
data for monitoring the state of heritage monuments is be-
coming increasingly common [16]–[19] and is particularly
worth recommending in the case of el Fuerte de Samaipata.
References /Bibliografia
[1] Kościuk J., Modern 3D scanning in modelling, documentation
and conservation of architectural heritage, [in:] J. Jasieńko (ed.),
Structural analysis of historical constructions: proceedings of the
International Conference on Structural Analysis of Historical Con-
structions 2012, 15–17 October 2012, Vol. 1, Dolnośląskie Wy-
dawnictwo Edukacyjne, Wrocław 2012, 64–76.
[2] Barber D.M., Dallas R.W., Mills J.P., Laser scanning for architec-
tural conservation, “Journal of Architectural Conservation” 2006,
Vol. 12, Iss. 1, 35–52, doi: 10.1080/13556207.2006.10784959.
[3] Van Genechten B., Theory and Practice on Terrestrial Laser Scan-
ning: Training Material Based on Practical Applications, Univer-
sidad Politecnica de Valencia Editorial, Valencia 2008.
[4] Remondino F., Campana S., 3D Recording and modelling in ar-
chaeology and cultural heritage theory and best practices, BAR
international series, 2598, Archaeopress, Oxford 2014.
[5] Fiorillo F., Remondino F., Barba S. et al., 3Ddigitizationandmap-
pingofheritagemonumentsandcomparisonwithhistoricaldraw-
ings, “The International Archives of the Photogrammetry, Remote
Sensing and Spatial Information Sciences” 2013, Vol. II-5 W, 1,
133–138, doi: 10.5194/isprsannals-II-5-W1-133-2013.
[6] Grussenmeyer P., Landes T., Voegtle T. et al., Comparison meth-
ods of terrestrial laser scanning, photogrammetry and tacheometry
data for recording of cultural heritage buildings, “The Internation-
al Archives of the Photogrammetry, Remote Sensing and Spatial
Information Sciences” 2008, Vol. 36, 213–218.
[7] Kottke J., An Investigation of Quantifying and Monitoring Stone
Surface Deterioration Using Three Dimensional Laser Scanning,
Master’s Thesis, University of Pennsylvania, Philadelphia, PA,
2009, https://repository.upenn.edu/cgi/viewcontent.cgi?article= 1126
&context=hp_theses [accessed: 21.05.2019].
[8] Rüther H., Chazan M., Schroeder R. et al., Laser scanning for conser-
vation and research of African cultural heritage sites: The case study
of WonderwerkCave, South Africa, “Journal of Archaeological Sci-
ence” 2009, Vol. 36, Iss. 1, 1847–1856, doi: 10.1016/j.jas.2009.04.012.
[9] Fabbri S., Sauro F., Santagata T. et al., High-resolution 3-D map-
ping using terrestrial laser scanning as a tool for geomorpholog-
ical and speleogenetical studies in caves: An example from the
Lessinimountains(NorthItaly), “Geomorphology” 2017, Vol. 280,
16–29, doi: 10.1016/j.geomorph.2016.12.001.
[10] Zhou K., Zhao X., Zhou J. et al., Application of terrestrial laser
scanning for heritage conservation in Yungang Grotto, “The In-
ternational Archives of the Photogrammetry, Remote Sensing and
Spatial Information Sciences” 2008, Vol. 37, Part B5, 337–340.
[11] Lercari N., Monitoring Earthen Archaeological Heritage using
MultiTemporal Terrestrial Laser Scanning and Surface Change
Detection, “Journal of Cultural Heritage” 2019, Vol. 39, 152–165,
doi: 10.1016/j.culher.2019.04.005.
[12] Remondino F., 3D recording for cultural heritage, [in:] D. Cowley
(ed.), Remote Sensing for Archaeological Heritage Management.
Proceedings of the 11
th
EAC Heritage Management Symposium,
25–27March2010,Reykjavík, Occasional Publication of the Aerial
Archaeology Research Group No. 3, Europae Archaeologia Consil-
ium (EAC), Brussels 2011, 107–116, doi: 10.1179/146195712X13
382850644938.
[13] Guarnieri A., Fissore F., Masiero A. et al., From Tls Survey To 3D
Solid Modeling for Documentation of Built Heritage: the Case
Study of Porta Savonarola in Padua, “The International Archives
of the Photogrammetry, Remote Sensing and Spatial Information
Sciences” 2017, Vol. XLII-2/W5, 303–308, doi: 10.5194/isprs-ar-
chives-XLII-2-W5-303-2017.
[14] Murtiyoso A., Grussenmeyer P., Documentation of heritage build-
ings using close-range UAV images: dense matching issues, com-
parison and case studies, “The Photogrammetric Record” 2017,
Vol. 32, Iss. 159, 206–229, doi: 10.1111/phor.12197.
[15] Periodic Reporting: A Handbook for Site Managers, The World
Heritage Convention Third Cycle of Periodic Reporting 2018–2024,
2018, https://whc.unesco.org/en/periodicreporting/ [accessed:
22.08.2018].
[16] Guarnieri A., Milan N., Vettore A., Monitoring of Complex Structure
forStructuralControlUsingTerrestrialLaserScanning(Tls)and
Photogrammetry, “International Journal of Architectural Heritage”
2013, Vol. 7, Iss. 1, 54–67, doi: 10.1080/15583058.2011.606595.
[17] Selbesoglu M.O., Bakirman T., Gokbayrak O., Deformation mea-
surement using terrestrial laser scanner for cultural heritage, “The
International Archives of the Photogrammetry, Remote Sensing
and Spatial Information Sciences” 2016, Vol. XLII-2/W1, 89–93,
doi: 10.5194/isprs-archives-XLII-2-W1-89-2016.
[18] Park H.S., Lee H.M., Adeli H. et al., ANewApproachforHealth
Monitoring of Structures: Terrestrial Laser Scanning, “Compu ter-
Aided Civil and Infrastructure Engineering” 2007, Vol. 22, Iss. 1,
19–30, doi: 10.1111/j.1467-8667.2006.00466.x.
[19] Tapete D., Casagli N., Luzi G. et al., Integrating radar and la-
ser-based remote sensing techniques for monitoring structural
deformation of archaeological monuments, “Journal of Archaeo-
logical Science” 2013, Vol. 40, Iss. 1, 176–189, doi: 10.1016/j.jas.
2012.07.024.
34 Jacek Kościuk, Bartłomiej Ćmielewski, Małgorzata Telesińska, Anna Kubicka
Abstract
This paper concerns El Fuerte de Samaipata – one of Bolivia’s most important monuments inscribed on the UNESCO World Heritage List. The study
describes the hardware and software used in the project “Architectural examination and complex documentation of Samaipata (Fuerte de Samaipata/
Bolivia) site from the World Heritage List”, as well as the workow adopted for the terrestrial laser scanning (TLS) of the site. It also explains the
important role that TLS played in the entire project.
Key words: Bolivia, Samaipata, UNESCO World Heritage List, rock art, 3D scanning
Streszczenie
Artykuł dotyczy El Fuerte de Samaipata – jednego z najważniejszych zabytków Boliwii wpisanego na Listę Światowego Dziedzictwa UNESCO.
Opisano aparaturę i oprogramowanie zastosowane w projekcie „Badania architektoniczne i kompleksowa dokumentacja stanowiska Samaipata
(Fuerte de Samaipata/Boliwia) z Listy Światowego Dziedzictwa”, a także metodologię przyjętą dla naziemnego skanowania laserowego (TLS).
Wyjaśniono również ważną rolę, jaką w całym projekcie odgrywa TLS.
Słowa kluczowe: Boliwia, Samaipata, Lista Światowego Dziedzictwa UNESCO, sztuka naskalna, laserowe skanowanie 3D
Acknowledgements /Podziękowania
Thepresentedworkisapartoftheresearchsponsoredbythegrantgiv-
entotheWrocławUniversityofScienceandTechnologybythePolish
National Science Centre (grant No. 2014/15/B/HS2/01108). Additio-
nally, the municipality of Samaipata, represented by Mayor Falvio Ló-
pes Escalera, contributed to this research by providing the accommo-
dationduring the eldwork in June and July 2016, as well as in July
2017. The Ministry of Culture and Tourism of Bolivia kindly granted
all necessary permits (UDAM No. 014/2016; UDAM No. 060/2017).
The research was conductedin close cooperation with theCentrefor
Pre-Columbian Studies of the University of Warsaw in Cusco. Spe-
cialists from many other universities and research centres also joined
theproject.