2019
2(58)
DOI: 10.5277/arc190206
Marta Rusnak*, Piotr Chmielewski**, Joanna Szewczyk***
Zmiany w postrzeganiu prezbiterium przy różnej długości nawy.
Kościół tunelowy w badaniach okulograficznych
Changes in the perception of a presbytery with a different nave length.
Funnel church in eye tracking research
Wprowadzenie
Przyczyna podjęcia rozważań
W jednej ze swoich książek prof. Juliusz Żórawski za
mieścił wypowiedź, która sugeruje, iż istnieją schematy
po znawcze obiektów architektonicznych. Odniósł się
szczególnie precyzyjnie do wnętrza katedry gotyckiej,
w której widz, jego zdaniem, wędruje kolejno, ogarniając
rytm służek i słupów, a dopiero zdając sobie sprawę z dłu
gości układu, kieruje wzrok ku górze [1].Trudno zgodzić
się z tym stwierdzeniem – zupełnie inaczej odczuwamy
świątynie francuskie, angielskie czy włoskie. Te niskie
i te wysokie, kamienne i kolorowe wywołują, przynaj
mniej u autorów, odmienne uczucia, a w związku z tym
i inne za chowania. Wydaje się, że wypowiedź Profesora
zawarta w książce Siatka prostych. O architekturze nad
indywi dualnej jest nacechowana doświadczeniem osoby
perfek
cyjnie znającej logikę tworzenia formy gotyckiej [1,
s. 36]
. Ta książka była jednym z impulsów, który nakiero
wał nasze poszukiwania badawcze w stronę weryfikacji
Introduction
The reason for undertaking our considerations
Professor Juliusz Żórawski in one of his books includ
ed a statement suggesting the existence of cognitive
schemes of architectural objects. He referred particularly
precisely to the interior of a Gothic cathedral, in which
the viewer, in his opinion, wanders successively, embrac
ing the rhythm of supports and pillars, and only when re
alizing the length of the system, she/he starts looking up
wards [1]. It is difficult to agree with this statement
because we perceive French, English or Italian churches
in a completely different way. All these structures, wheth
er low or high, stony or colourful, do evoke different feel
ings, at least in the authors’ opinion and therefore they
bring about various behaviours. It seems that the profes
sor’s statement contained in the book Siatka prostych.
O archi tekturze nadindywidualnej (Grid of Straight Lines.
On Overindividual Architecture) is characterized by the
experience of a person who is perfectly familiar with the
logic of creating a Gothic form [1, p. 36]. This book was
one of the impulses that directed our research towards the
verification of theories regarding the perception of his
torical objects, i.e. interiors, facades and historic architec
tural layouts
1
. Consequently, this article presents the re
search on changes in the perception of the Gothic church
1
The results of the survey on the perception of cathedrals consist
of three parts.
* ORCID: 0000000256395326. Wydział Architektury Poli
techniki Wrocławskiej/Faculty of Architecture, Wrocław University of
Science and Technology.
** ORCID: 0000000202909969. Wydział Architektury Poli
techniki Wrocławskiej/Faculty of Architecture, Wrocław University of
Science and Technology.
*** ORCID: 000000023026407X. Wydział Architektury Poli
techniki Wrocławskiej/Faculty of Architecture, Wrocław University of
Science and Technology.

74 Marta Rusnak, Piotr Chmielewski, Joanna Szewczyk
teorii dotyczących percepcji obiektów historycznych:
wnętrz, elewacji i zabytkowych układów architektonicz
nych
1
. W konsekwencji w niniejszym artykule zaprezento
wano badania dotyczące zmian percepcji układu kościoła
gotyckiego wraz ze wzrostem długości jego nawy. Badacze,
by nie sięgać do subiektywnej, eksperckiej wiedzy – per
spektywy zarzuconej autorowi przywołanej wy powiedzi,
zadbali o to, aby w doświadczeniu wzięły udział wyłącznie
osoby niezwiązane pod względem wykształcenia lub profe
sji z architekturą, sztuką czy zabiegami konserwatorskimi.
Katedra jako świadoma architektoniczna kreacja
Teologiczne centrum każdej świątyni chrześcijańskiej
stanowi ołtarz. To wokół niego koncentruje się życie du
chowe wspólnoty eklezjalnej. Dążenie ku prezbiterium
jest rozumiane jako droga od grzechu ku zbawieniu [2].
Temat zaklętych w strukturze katedry gotyckiej znaczeń
porusza bardzo wielu badaczy, wśród których wymienić
można na przykład takie nazwiska jak Duby [3], Norman
[4], Walczak [5], von Simson [6], Bałus [7], Erlande
Brandenburg i MérelBrandenburg [8], HenryClaude,
Stefanon i Zaballos [9] oraz Panofsky [10]. Wśród wy
mienionych postaci znajdują się historycy sztuki, teologo
wie, architekci. Zgodnie z wnioskami wyciągniętymi
z ich naukowych poszukiwań, ołtarz umieszczony w pre
zbiterium wydaje się punktem, gdzie wszystko się zbie
ga. Te cechy sprawiają, iż koniec nawy głównej katedry
gotyckiej jest najważniejszym miejscem w tej budowli.
Je żeli się przyjmie, że katedry były wznoszone rękoma
w pełni świadomych twórców umiejących połączyć w har
monijną całość formę, funkcję i treść, można wniosko
wać, że projekt katedry stawiał przed nimi wyzwanie kie
rowania ludzką uwagą. Mieli oni tak ukształtować całość
katedry, aby przyciągnąć i utrzymać wzrok obserwatorów
w ściśle określonych miejscach o rytualnym znaczeniu.
O tym, że projektowanie katedry było procesem nieprzy
padkowym, świadczą pisma opata Sugera oraz Bernar da
z Clairvaux [11].
Autorów interesowało szczególnie to, na ile wydłużanie
nawy głównej gotyckiej katedry przekłada się na percepcję
całego układu, kiedy obserwatorzy są bardziej skłonni do
koncentracji większej części swojej uwagi wzrokowej
w obrębie prezbiterium, niejako wciągani są przez tunel
2
.
Hipoteza badawcza
Wzrost długości katedr gotyckich miał ułatwić odczy
tanie zapisanych w ich strukturze symbolicznych treści.
Ewolucja proporcji gotyckich świątyń podkreślała zna
czenie prezbiterium i znajdującego się w nim ołtarza.
Celem wydłużania katedry były jednocześnie: manifesta
cja boskiej potęgi, oddanie ziemskiego trudu dotarcia do
celu, jakim jest zbawienie, a także wymuszenie dłuższej
i pełnej skupienia wizualnej kontemplacji prezbiterium.
1
Wyniki sondażu dotyczącego percepcji katedr składają się
z trzech części.
2
Autorzy mają na myśli wydłużone wnętrze kościoła longitudial
nego tworzącego tunel nawy głównej zakończony prezbiterium.
layout along with the increase in its nave length. Re
searchers, in order not to refer to the subjective and expert
knowledge, being against the perspective of the quoted
statement by the author, decided to include in the experi
ment exclusively the subjects who were not connected
with architecture, art or restoration treatments as regards
their education or profession.
The cathedral as a conscious architectural creation
The theological centre of every Christian church is the
altar. It is around the altar that the spiritual life of the ec
clesial community is focused. Going towards the presby
tery is understood as a route from sin to salvation [2]. The
issue of meanings, which are enchanted in the structure of
a Gothic cathedral, is very popular with researchers,
among whom names such as Duby [3] and Norman [4],
Walczak [5], von Simson [6], Bałus [7], ErlandeBran
den burg and MérelBrandenburg [8], HenryClaude, Ste
fanon and Zaballos [9], Panofsky [10] can be mentioned.
There are art historians, theologians, and architects among
the abovementioned authors. According to the conclu
sions drawn from their scientific searches, the altar which
is placed in the presbytery seems to be the point where
everything comes together. These features make the end
of the Gothic cathedral nave the most important place in
this building. If we assume that cathedrals were construct
ed by the hands of fully conscious creators who were able
to combine the form, function and content in a harmoni
ous whole, then it can be concluded that they were chal
lenged to control human attention by means of the cathe
dral’s design. They were supposed to shape the entire
cathedral so as to attract the observer’s eye and maintain
it on strictly defined places of ritual significance. The fact
that the action of designing a cathedral was a nonacci
dental process is evidenced by the writings by Abbot
Suger and Bernard of Clairvaux [11].
The authors were particularly interested in how far the
extension of the Gothic cathedral nave reflects the per
ception of the entire layout when observers are more
likely to concentrate most of their visual attention within
the presbytery and are somehow drawn in through the
tunnel
2
.
Research hypothesis
The increase in the length of Gothic cathedrals was
aimed at facilitating the understanding of symbolic con
tents which were hidden in their structures. The evolution
of proportions of Gothic temples emphasised the impor
tance of the presbytery and the altar which was situated in
it. The purpose of extending the cathedral was at the same
time a manifestation of the divine power, depicting the
earthly effort to reach the goal of salvation as well as forc
ing a longer and fully focused visual contemplation of the
presbytery.
2
The authors mean the extended interior of the longitudinal church
which forms the nave tunnel finished with the presbytery.

Kościół tunelowy w badaniach okulograficznych /Funnel church in eye tracking research 75
Przygotowanie i przeprowadzenie badania
Czym jest okulografia?
Okulografy (eye tracker) to przyrządy dające możliwość
rejestracji oglądanego obrazu wraz z dokładnym zapisem
sposobu patrzenia na prezentowane bodźce. Najczęściej
wykorzystuje się je do prowadzenia badań marketingo
wych dotyczących reklam czy oceny funkcjonalności
stron internetowych, ale też na przykład w medycynie.
W czasie prowadzonych testów wykorzystano okulo
graf stacjonarny, pozwalający na badanie obrazów, zdjęć
i filmów wyświetlanych na ekranie znajdującym się
przed obserwatorem. Urządzenie RED250Hz Portable
[12] było
zainstalowane pod monitorem. W oprawie okulo
grafu znaj
dują się źródła światła podczerwonego, którego
skupione wiązki wysyła się w kierunku oczu obserwato
ra. Kamera podczerwona śledzi powstające na gałkach
ocz nych odbicia, a specjalne oprogramowanie koordynu
je zebrane dane, co umożliwia późniejsze wskazanie trasy
wodzenia wzrokiem w podziale na sakkady i fiksacje.
Fiksacja to zatrzymanie ruchu obu gałek ocznych na tym
fragmencie sceny wizualnej, która aktualnie znajduje się
na linii wzroku [13]. Właściwie tylko w czasie fiksacji
mo żliwe jest świadome postrzeganie otaczającego nas
świa ta. Sakkady to ruchy kadrujące oczu, których nad
rzędnym celem jest precyzyjne ustawianie osi widzenia
gałek ocz nych na fragmencie sceny wizualnej [13]. Dzięki
takiej uproszczonej charakterystyce możliwe jest dalsze
matematyczne opracowanie danych polegające na po
dziale ilustracji na zgodne z potrzebami badania pola za
interesowań (areas of interest – AOI) [13]–[15]. Dzięki
temu fiksacje są kolejno przyporządkowywane do tych
grup, stanowiąc zbiory, na których program komputero
wy, w tym przypadku BeGaze SMI, dokonuje obliczeń
i generuje różnego rodzaju raporty w formie diagramów,
wykresów i zestawień.
Wchodząc w tematykę badań neuronalnych, w tym oku
lograficznych, nad sztuką, nieodzowne wydaje się przy
wołanie badań Oniansa, a tym samym jego książki za
tytułowanej Neuroarthistory. From Aristothele and Pli ny
to Baxandall and Zeki [16]. Cenne informacje pozwalają
ce na lepsze zrozumienie idei wykorzystania inżynierii
biomedycznej do pogłębienia wiedzy o szeroko rozumia
nej sztuce znajdują się w publikacjach autorstwa Francuza
[15], Kędziory [17] oraz FolgiJanuszewskiej [18].
Dlaczego zdecydowano się na badania
na podstawie wizualizacji?
Porównanie konkretnych katedr mających różne pro
porcje w rzeczywistości byłoby najbardziej naturalne,
jednak niekorzystne dla późniejszego naukowego wnio
skowania. W warunkach naturalnych każda z badanych
katedr cechuje się nieco innym oświetleniem, innym ko
lorytem wnętrza wywołanym różnym typem budulca
i kolorystyką witraży, innym podziałem żeber sklepienia,
odmienną stylistyką detalu, odmienną wielkością ołtarza,
obecnością lub brakiem ambony i stalli, innym typem ła
wek czy świeczników. Kolejnych różnic można by było
Preparation and carrying out the research
What is eyetracking?
The essence of eye trackers is the ability to simultane
ously record the image viewed along with an accurate
record of the way of looking at the presented stimuli.
They are most often used to carry out marketing research
on advertising or to evaluate the functionality of websites,
but also, for example, in medicine.
During our tests a stationary eye tracker was applied
which made it possible to test images, photos and films
displayed on the screen in front of the observer. RED250Hz
Portable Device [12] was installed under the monitor. In
the eye tracker’s frame there are infrared light sources
whose focused beams are sent towards the observer’s
eyes. The infrared camera tracks the reflections that ap
pear on the eyeballs and the special software coordinates
the data collected, which later makes it possible to indi
cate the route of eyes’ movement, which is divided into
saccades and fixations. Fixation means stopping the mo
vement of both eyeballs on this fragment of the visual
scene that is currently on the line of sight [13]. Actually,
the conscious perception of the world which surrounds us
is possible at the time of fixation only. Saccades are crop
ping movements of eyes, whose primary goal is precise
setting of the visual axis of eyeballs on a fragment of
the visual scene [13]. Thanks to such simplified charac
teristics, it is possible to further develop mathematical
data based on the division of illustrations into Areas of
Inte rests which are in accordance with the research needs
(AOI) [13]–[15]. As a result, fixations are subsequently
assigned to these groups and form sets on which the com
puter program, in this case BeGaze SMI, performs cal
culations and generates various types of reports in the
form of diagrams, charts and comparisons.
Discussing the issue of neural research, including eye
tracking, into art, it seems indispensable to recall Onians’
studies and thus his books: Neuroarthistory. From Ari sto
thele and Pli ny to Baxandall and Zeki [16]. This is where
we can find some valuable information enabling
better
understanding of the idea of using biomedical engineer
ing to deepen the knowledge of broadly understood art. In
the studies of Francuz [15], Kędziora [16] and FolgaJa nu
szewska we can find some valuable information.
Why was our research carried out
on the basis of visualizations?
A comparison of specific cathedrals which have differ
ent proportions in reality would be the most natural meth
od, however, apparently unfavourable for the subsequent
scientific conclusions. In natural conditions, each of the
researched cathedrals is characterized by slightly different
lighting, varrying interior colour resulting from various
types of the building material and stainedglass colours,
another division of the vault ribs, different stylistics of the
detail, a various altar size, the presence or lack of the pul
pit and choirstalls, other types of pews or candlesticks. In
fact, many other differences could also be found. More

76 Marta Rusnak, Piotr Chmielewski, Joanna Szewczyk
odnaleźć naprawdę wiele. Poza tym trudno byłoby prze
prowadzić miarodajne badania w kościołach, w których
raz znajduje się wielu wiernych, a raz jedynie kilkoro spa
cerujących po wnętrzu i wykonujących zdjęcia turystów.
Są to zbyt odmienne poznawczo sytuacje, by móc użyć ich
do badań. Z tych względów zrezygnowano z użycia jako
bodźców zdjęć prawdziwych wnętrz. Chcąc umożliwić
za rejestrowanie niezakłóconych tą zmiennością danych,
nakierowanych wyłącznie na zmianę proporcji wnętrza,
ujednolicono wymienione elementy. Stąd w prezentowa
nym sondażu zdecydowano się na stworzenie wizualizacji
modelowego wnętrza o uśrednionych, spotykanych w tym
okresie proporcjach i późniejsze modyfikowanie liczby
przęseł w badanym układzie.
Parametry do tych działań zostały zaczerpnięte z rze
czywistości. Rozpatrywane przykłady ograniczono do ka
tedr francuskich wzniesionych od końca XII do początku
XIV w. [8]. Pod względem badawczym ta grupa została
uznana za najbardziej homogeniczny zbiór. Dodatkowo
z tej szerokiej grupy wyłoniono wyłącznie te świątynie,
których struktura ścian międzynawowych jest trójpasmo
wa i składa się z pasa filarów, opartych na nich ostrołu
ków, poziomu fryzu arkadowego (często triforiów) oraz
pasa ostrołucznych okien. Za kościół modelowy przyjęto
katedrę w Reims. Za katedralne ekstrema uznano Bourges
o najmniejszej liczbie przęseł w nawie głównej oraz kate
drę w Rouen będącą najdłuższym układem. Wizualizację
dla tych trzech przypadków wykonał Wojciech Fikus, dba
jąc o to, aby na ilustracjach nie zmieniła się szerokość i wy
sokość nawy, a kamera znajdowała się w tej samej pozycji
względem wejścia do nawy głównej. W ten sposób otrzy
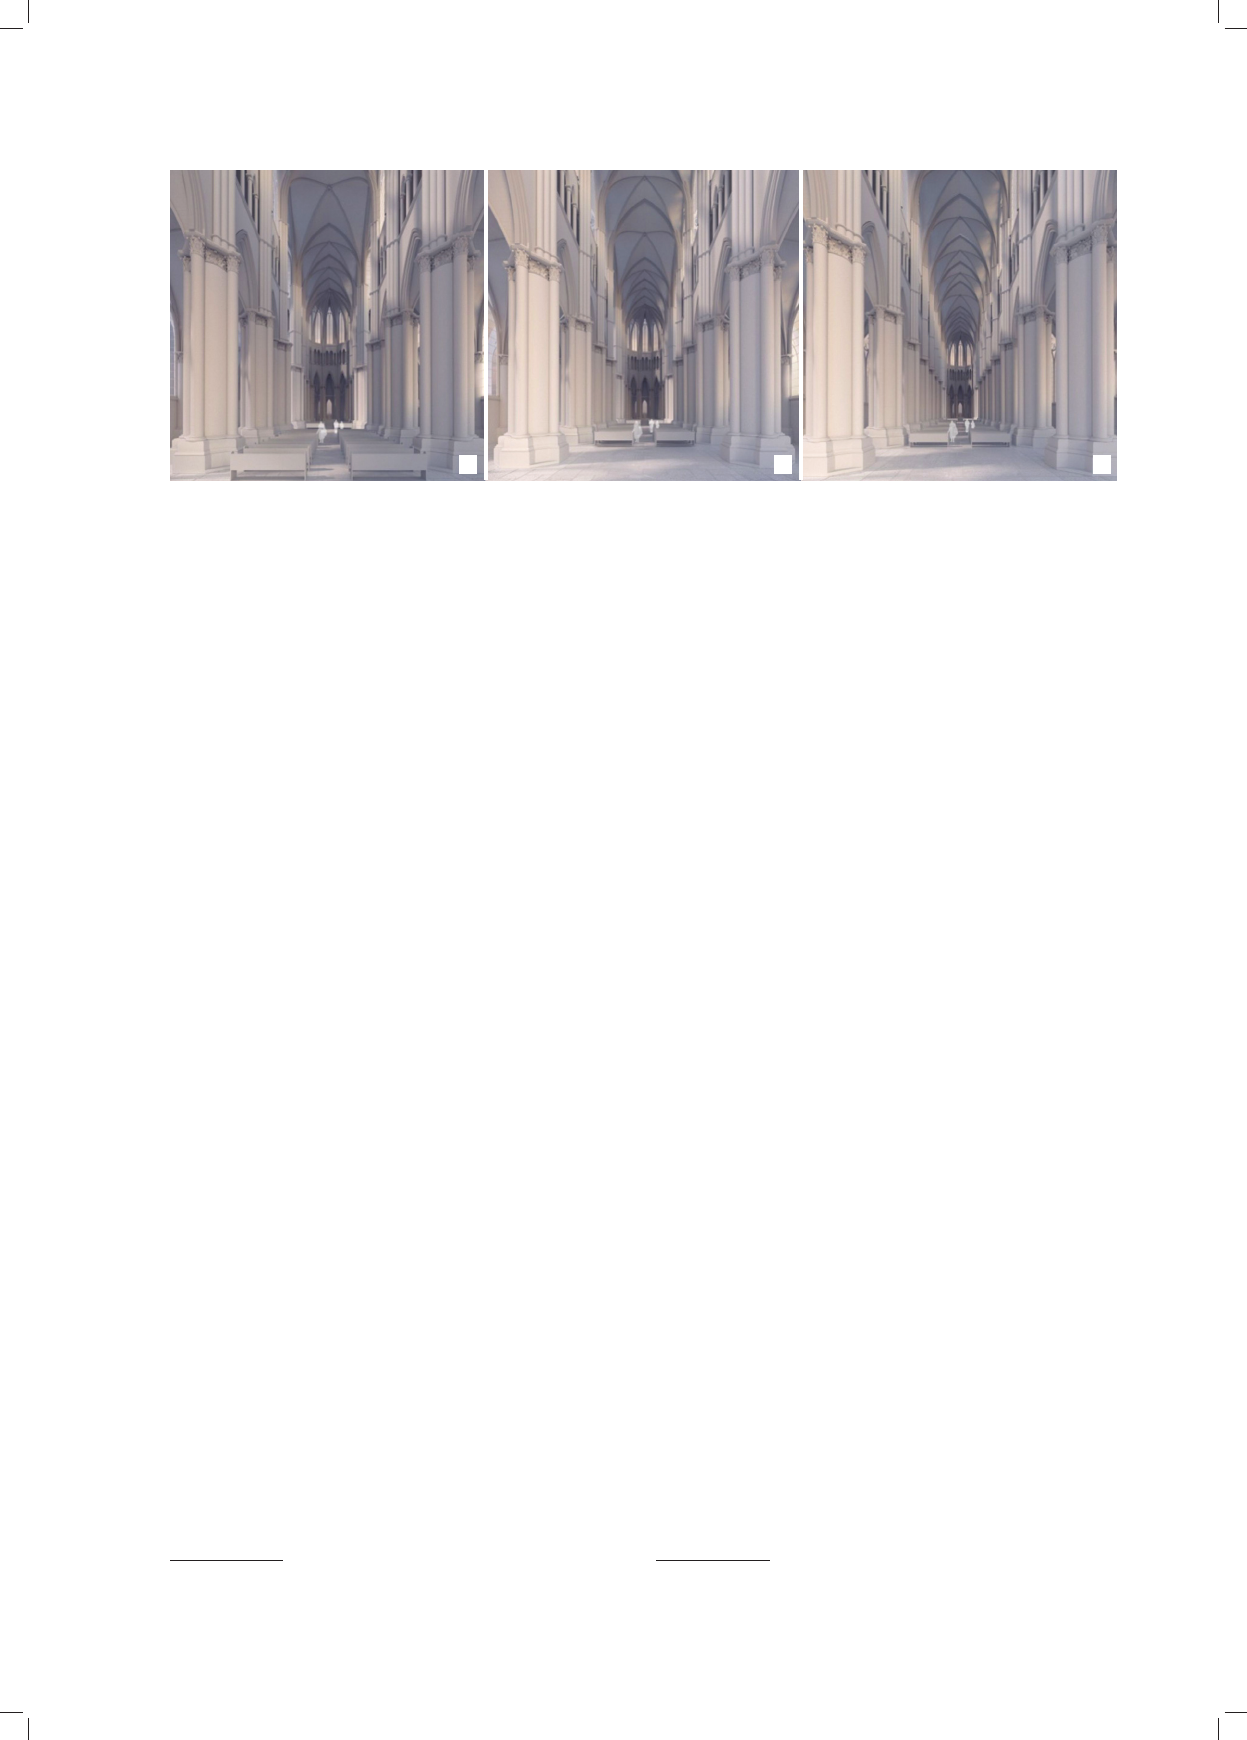
mano trzy prezentowane w czasie badań ilustracje (il. 1).
Czas badania
Dużym wyzwaniem dla przeprowadzających test oku
lograficzny było określenie, jak długo można postulować
badanie eye trackingowe tych wnętrz za pomocą przed
stawienia statycznego, czyli zdjęcia wyświetlanego na
ekranie monitora. Procedurę dochodzenia do odpowied
niego czasu badania przedstawiono w [18]. W związku
z opisanymi poszukiwaniami stwierdzono, iż czas patrze
nia na wizualizacje wyświetlane na monitorze nie po
winien przekraczać 8 s. Można było przypuszczać, iż
dla czasu przekraczającego 8 s badanie wykorzystujące
ilustracje z pewnością nie odnajdzie już przełożenia na
rzeczywistą trójwymiarową sytuację zapoznawania się
z wcześniej nieoglądanym wnętrzem gotyckiego kościoła.
Badane osoby
We właściwym badaniu uczestniczyli wolontariusze.
Umieszczona na stronie internetowej ankieta miała na
celu głównie wykluczenie udziału osób patrzących na ar
chitekturę w sposób profesjonalny. Uczestnicy deklaro
wali, że nie mają wykształcenia architektonicznego, nie
zajmują się konserwatorstwem czy historią sztuki. Wy
eliminowanie eksper tów wydawało się niezbędne w świe
tle refleksji dotyczących wypowiedzi prof. Żórawskie
go. Tylko pod takim warunkiem na późniejszym etapie
over, it would be difficult to carry out reliable research in
churches, in which sometimes there are many people,
whereas at other times only a few tourists walking around
the interior and taking pictures. These are too cognitively
different situations to be included in the research. For
those reasons, real interior photographs were not used as
stimuli. To enable the recording of undisturbed data with
this changeability and aimed only at changing the propor
tion of the interior, the exchanged elements were unified.
Hence, in the presented survey, the authors decided to cre
ate a visualization of the model interior with averaged and
characteristic of this period proportions as well as a sub
sequent modification of the number of bays in the re
searched layout.
Parameters for these activities were taken from reality.
The discussed examples were limited to French cathe
drals which were constructed from the end of the 12
th
to
the beginning of the 14
th
century [8]. In terms of the re
search, this group was considered to be the most homog
enous collection. Moreover, from this wide group only
these temples were selected, whose structure of the walls
between the nave and aisles is threeband and consists of
a row of pillars, ogival arches on them, the arcade frieze
level (often triforia) and a row of ogival windows. The
cathedral in Reims was adopted as a model church.
Bourges with the smallest number of bays in the nave and
the cathedral in Rouen being the longest layout were con
sidered to be the cathedral extremes. The visualization for
these three cases was made by Wojciech Fikus. He made
sure that in illustrations there was no change in the width
and height of the nave and the camera was in the same
position in relation to the entrance to the nave. In this
way, three illustrations were obtained which were pre
sented during the research (Fig. 1).
Research time
One of the biggest challenges for those who carried out
the eye tracker test was to determine the time during
which the eye tracking examination of these interiors
could be postulated by means of a static representation,
i.e., a photo displayed on the monitor screen. The proce
dure for reaching the appropriate examination time was
presented in [18]. In connection with the described
searches it was found that the time of looking at the visu
alizations which were displayed on the monitor should
not exceed 8 s. It could be assumed that for a time exceed
ing 8 s, the examination which used illustrations would no
longer be reflected in the real threedimensional situation
of familiarizing with the previously unseen interior of
a Gothic church.
The subjects
Volunteers participated in the study proper. The ques
tionnaire, which was presented on the website, was main
ly intended to exclude the participation of people who
would perceive architecture in a professional manner. The
participants declared that they did not have architectural
education, did not deal with restoration or the history of
Kościół tunelowy w badaniach okulograficznych /Funnel church in eye tracking research 77
można twierdzić, że oglądanie przygotowanych ilustracji
nie było procesem zmienionym przez specjalistyczną
edukację zawodową. W czasie badania korzystano z pro
gramu Experiment Center, a zebrane w trzy dni dane
opracowano w programie BeGaze SMI [12]. Ostatecznie
na prezentowane ilustracje patrzyło 76 pełnoletnich osób
mieszkających we Wrocławiu
3
.
Mężczyźni
stano
wili
44,8% badanych
, pozostałe 55,2% kobiety. Więk szość
wolontariuszy – 44 osoby – liczyła od 18 do 30 lat. W ko
lejnej grupie znalazło się 14 osób w wieku od 31 do 40 lat,
12 badanych miało od 41 do 50 lat. Pozostałych 6 uczest
ników miało więcej niż 50 lat.
Analiza nagrań
Część pierwsza – uwaga poświęcana elementom
o zmienionych proporcjach
Na każdej z wizualizacji badacze zawczasu wyznaczyli
pola zainteresowania – AOI [19] podzielone na pięć stref:
sklepienia, prezbiterium, oba ciągi filarów międzynawo
wych ze ścianami z triforiami, a także połączone w jeden
zbiór posadzki, ławki i sylwetki ludzkie. Bardziej rozbudo
wane dane zestawiono w tabeli (tab. 1). Po rów nanie zmian
wartości w konkretnej strefie ułatwiają schematy (il. 2–4).
W konsekwencji wydłużania kościoła prezbiterium od
dala się od obserwatora, jednocześnie maleje wraz z pro
porcjonalną zmianą skali umieszczonego tam detalu.
Po takiej transformacji sklepienie nawy staje się dłuższe,
a jego pole większe. Ciąg filarów także się wydłuża, skła
da się z większej liczby elementów. W przypadku ścian
międzynawowych zmiana pola tej strefy nie jest znacząca.
W efekcie transformacji na ilustracji znajduje się więcej
trudnych do odczytania szczegółów. Poprzez zmniejszenie
liczby przęseł prezbiterium jest bliżej i wydaje się więk
sze, a budujące je elementy architektoniczne stają się bar
3
Na ilustrację A patrzyły 23 osoby, wizualizację B obejrzało 31 osób,
a ilustrację C – 22 osoby.
art. The elimination of experts seemed to be necessary in
the light of reflections on the statements made by Professor
Żórawski. Only under such a condition can it be claimed
at a later stage that watching the illustrations prepared was
not a process that was changed by specialist vocational
education. During the research, the Experiment Centre
program was used, and the data collected within three
days were processed in the BeGaze SMI program [12].
Finally, 76 adult people who lived in Wrocław looked at
the pictures presented to them
3
. 44.8% of the respondents
were men, the remaining 55.2% were women. Most of the
volunteers – 44 people – were at the age of 18 to 30.
There were 14 people in the next group who were aged
from 31 to 40, 12 subjects were between 41 and 50 years
old. The remaining six participants were over 50 years old.
Analysis of the recordings
Part one – attention paid to elements
with changed proportions
In each of the visualizations, the researchers deter
mined Areas of Interests in advance – AOI [19] which
were divided into five zones: the vault, presbytery, both
lines of pillars between the nave and aisles along with the
walls with triforia, and also floors, pews and human fig
ures which were combined in one set. More extensive
data were presented in the table (Table 1). The diagrams
(Fig. 2–4) make it easier to compare changes in the value
in a specific zone.
Due to the extension of the church, the presbytery
moves away from the observer and at the same time it
decreases in size along with a proportional change in the
scale of the detail placed there. After this kind of transfor
mation, the nave’s vault becomes longer and its field big
ger. The line of pillars also extends and consists of more
3
23 people looked at illustration A, 31 people watched visualiza
tion B and 22 people – illustration C.
Il. 1. Wizualizacje wnętrz katedr o zmieniających się proporcjach: A – przykład krótkiej nawy, B – przykład nawy o uśrednionej długości – rama,
C – ilustracja prezentująca długą nawę (oprac. W. Fikus)
Fig. 1. Visualizations of the cathedrals of varying proportions: A – short example, B – an example of averaged asile,
C – an illustration showing a long asile (by W. Fikus)
CA
B

78 Marta Rusnak, Piotr Chmielewski, Joanna Szewczyk
dziej czytelne. Sklepienie i ściany nawy się skracają,
a wraz z tą zmianą maleje liczba detali: żeber, służek,
wiązek głowic. Przykładowo na pierwszej wizualizacji
w polu widzenia znajdują się cztery rzędy filarów nawy
głównej (il. 1A), w kolejnym pięć (il. 1B), a w ostatnim
aż osiem rzędów (il. 1C).
Patrząc po raz pierwszy na prezentowane schematy,
można by sądzić, że wraz ze wzrostem pola powierzchni
powinien zwiększać się odsetek osób, a także czas, jaki
ludzie poświęcają na jego poznawanie [19]. Stało się tak
tylko dla jednego z badanych parametrów, czyli skle
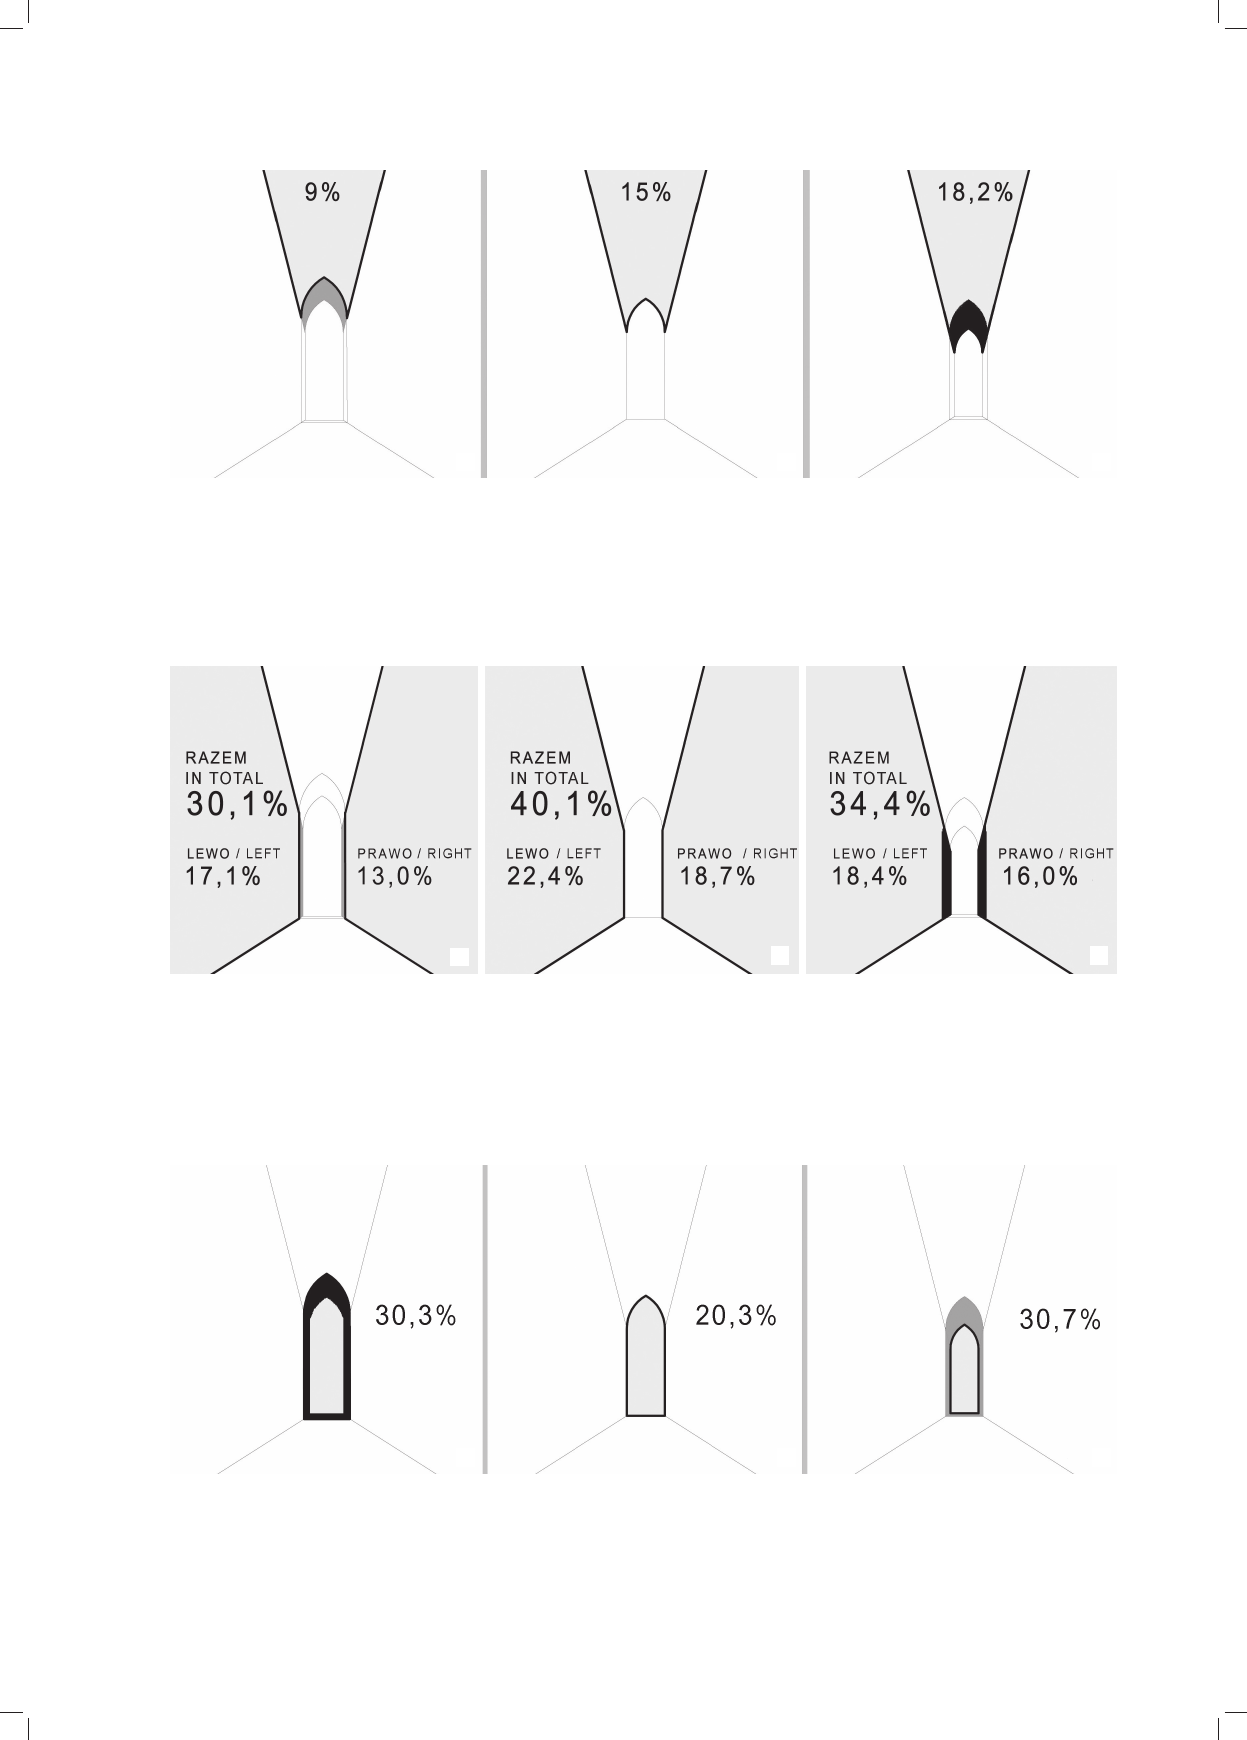
pień. W efekcie otrzymano wartości wynoszące 9% czasu
dla przykładu prezentującego krótką katedrę (il. 1A),
15% dla ilustracji ukazującej obiekt o przeciętnej długo
ści (il. 1B) oraz 18,2% uwagi dla najdłuższej wizualizacji
oznaczonej literą C. Jest to logicznie rosnący ciąg liczbo
wy przystający do wzrostu powierzchni sklepień prezen
towanych na obrazach (il. 2).
W czasie porównywania pól zainteresowania efekty
podjętej obserwacji nie wpisują się w prosty statystyczny
schemat myślowy sugerujący, że większe pole daje rezul
tat w postaci większej liczby osób obserwujących je przez
dłuższy czas, tak jak to miało miejsce w przypadku pól
sklepiennych. Oprogramowanie wskazało interesujące
wartości czasów skupienia dla stref międzynawowych,
któ re wyniosły odpowiednio: 30,1% (strona: lewa 17,1%,
pra wa 13,0%) dla krótkiego przykładu, 41,2% (strona:
lewa 22,5%, prawa 18,7%) dla uśrednionego wnętrza świą
tyni
oraz 34,4% (strona: lewa 18,4%, prawa 16,0%) dla
wersji długiej (il. 3).
Szczególnie intrygujący ze względów badawczych jest
wynik dotyczący czasu poświęcanego na poznawanie
prezbiterium (il. 4). Przeciętnie obserwatorzy poświęcali
20,4% swojej uwagi na zapoznawanie się z prezbiterium
w przypadku ilustracji ramowej – B. W wydłużonym ukła
dzie C, mimo że widoczne pole prezbiterium stało się
mniejsze, to poświęcona mu uwaga istotnie wzrosła do
30,7%. Co ciekawe, jest to efekt zbliżony do wartości ot
rzymanej dla krótkiego układu (30,3%). Są to wartości po
dobne, mimo że wielkość widocznego pola prezbiterium
została poprzez oddalenie pomniejszona o ponad jedną
trzecią. Czym więc różnią się te układy? Czy takie koszto
i czasochłonne wydłużanie katedr w celu uzyskania wizu
alnego skupienia miało sens i czy było to głównym celem
budowy coraz większych świątyń? Ten aspekt może zna
leźć swoje przełożenie również na rozważania nad per
cepcją współczesnych dokonań architektonicznych.
Charakter fiksacji
Co zaskakujące, dla ostatniej, budzącej wątpliwości
ilustracji C uśredniona liczba fiksacji policzona dla całe
go pola poznawczego jest najmniejsza i osiąga poziom
24,9 miejsc koncentracji uwagi. Dla dwóch pozostałych
przykładów, A i B, otrzymano dokładnie tę samą wartość
29,2 fiksacji. Zapoznawanie się z najdłuższym przykła
dem jest więc nieco „spokojniejsze” niż z przykładami
krótszymi (tab. 1).
W przypadku prezbiterium znajdującego się najbliżej
obserwatora liczba fiksacji poświęcona na jego obserwa
elements. In the case of walls between the nave and aisles,
the change in the area of this zone is not significant.
As a result of this transformation, the illustration contains
more details which are difficult to see. By reducing the
number of bays, the presbytery is closer and seems to be
larger, and the architectural elements that form them be
come more visible. The vault and the walls of the nave are
shortened and along with this change the number of de
tails decreases, i.e. ribs, supports, bundles of heads. For
example, in the first visualization there are four rows of
the main nave pillars in the field of view (Fig. 1A), in the
next there are five (Fig. 1B) and in the last field of view
there are eight rows (Fig. 1C).
Looking at the presented diagrams for the first time, it
could be inferred that along with the increase of the sur
face area, the percentage of people should increase as
well as the time which people devote to familiarising
themselves with it [19]. This turned out to be true for one
of the tested parameters only, i.e. in the case of vaults. As
a result, the values of 9% of the time were obtained for the
example which presented a short cathedral (Fig. 1A), 15%
for the illustration which showed the object of the average
length (Fig. 1B) and 18.2% of the attention for the longest
visualization marked with letter C. It is a logically growing
numerical sequence that matches the increase in the area
of vaults which were presented in the pictures (Fig. 2).
When comparing Areas of Interest, the effects of the
observation do not fit into a simple statistical thought
scheme suggesting that the larger area gives the result in
the form of a larger number of people watching it for
a longer time, as was in the case with the vault areas. The
software indicated interesting values of the focus times
for the zones between the nave and aisles, namely 30.1%
(side: left 17.1%, right 13.0%) for a short example, 41.2%
(side: left 22.5%, right 18.7%) for the average interior of
the temple and 34.4% (side: left 18.4%, right 16.0%) for
the long version (Fig. 3).
The result of the time devoted to getting to know the
presbytery is particularly intriguing in terms of research
reasons (Fig. 4). On average, observers devoted 20.4% of
their attention to familiarise themselves with the presbytery
in the case of frame illustration B. In the extended lay
out C, although the visible presbytery area became smaller,
the attention devoted to it significantly increased up to
30.7%.
Interestingly, it is the effect similar to the value
which was obtained for the short layout (30.3%). These
are similar values, although the size of the visible presby
tery’s area was reduced by over one third due to distanc
ing. So, how do these layouts differ from one another? Did
this costly and timeconsuming extension of cathedrals in
order to obtain a visual focus make any sense and was it
the main goal of constructing larger and larger temples?
This aspect may also be reflected in the discussion about
the perception of modern architectural achievements.
The nature of fixation
Surprisingly, for the last, doubtful illustration C, the
average number of fixations calculated for the entire cog
nitive area is the smallest and reaches the level of
Kościół tunelowy w badaniach okulograficznych /Funnel church in eye tracking research 79
Il. 2. Porównanie zmian uwagi wizualnej (dwell time) poświęcanej na poznawanie sklepień w poszczególnych przykładach:
A – krótkim, B – średnim i C – długim.
Oznaczenia kolorystyczne pól: jasnoszary – wartość referencyjna, czarny – wzrost wartości, ciemnoszary – spadek wartości (oprac. M. Rusnak)
Fig. 2. Comparison of dwell time on observing the vaults in examples: A – the shortest, B – medium, C – the longest.
Colors markings: light gray – reference value, black – increase in value, dark gray – decrease in value (by M. Rusnak)
Il. 3. Porównanie zmian uwagi wizualnej (dwell time) poświęcanej na poznawanie stref międzynawowych w poszczególnych przykładach:
A – krótkim, B – średnim i C – długim.
Oznaczenia kolorystyczne pól: jasnoszary – wartość referencyjna, czarny – wzrost wartości, ciemnoszary – spadek wartości (oprac. M. Rusnak)
Fig. 3. Comparison of dwell time on observing the areas on the sides of the nave in examples: A – the shortest, B – medium, C – the longest.
Colors markings: light gray – reference value, black – increase in value, dark gray – decrease in value (by M. Rusnak)
Il. 4. Porównanie zmian uwagi wizualnej (dwell time) poświęcanej na poznawanie prezbiteriów w poszczególnych przykładach:
A – krótkim, B – średnim i C – długim.
Oznaczenia kolorystyczne pól: jasnoszary – wartość referencyjna, czarny – wzrost wartości, ciemnoszary – spadek wartości (oprac. M. Rusnak)
Fig. 4. Comparison of dwell time on observing the presbytery in examples: A – the shortest, B – medium, C – the longest.
Colors markings: light gray – reference value, black – increase in value, dark gray – decrease in value (by M. Rusnak)
C
C
C
A
A
A
B
B
B

80 Marta Rusnak, Piotr Chmielewski, Joanna Szewczyk
cję jest większa niż w kolejnych przykładach i wiąże się
prawdopodobnie z chęcią obejrzenia detalu. Podczas ob
serwacji prezbiterium A wykonano zatem średnio 9,2 fik
sacji. Fiksacje te są najkrótsze, wynoszą średnio 241 ms.
Prezbiterium w przykładach B i C, mimo że poznawane
było przy użyciu podobnej liczby 6,6 fiksacji, różni się
dynamiką fiksacji. W średnim przykładzie dla całej strefy
zawierającej prezbiterium i powstałe w wyniku transforma
cji ściany i sklepienia trwanie fiksacji wzrosło do 312 ms.
Najspokojniej, wykonując fiksacje trwające aż 378 ms,
obserwowano prezbiterium w trzecim przykładzie, gdzie
nawa była naj dłuższa. Jest to czas zwiększony nawet
o 57% względem krótkiego przykładu katedry. Para metry
fiksacji pokazują „wizualny magnetyzm” ołtarza zamyka
jącego tunelowe wnętrze, zwłaszcza w przypad ku jego
oddalenia od obserwatora.
Dodatkowo zwrócić należy uwagę na to, że choć na
ilustracjach znajdują się tak samo wyglądające posadzka,
ławki i cienie pokazujące skalę postaci względem archi
tektury wnętrza, to czas poświęcany tym elementom ma
lał wraz z oddalaniem się prezbiterium od obserwatora.
Początkowo na zapoznanie się z tymi częściami wizuali
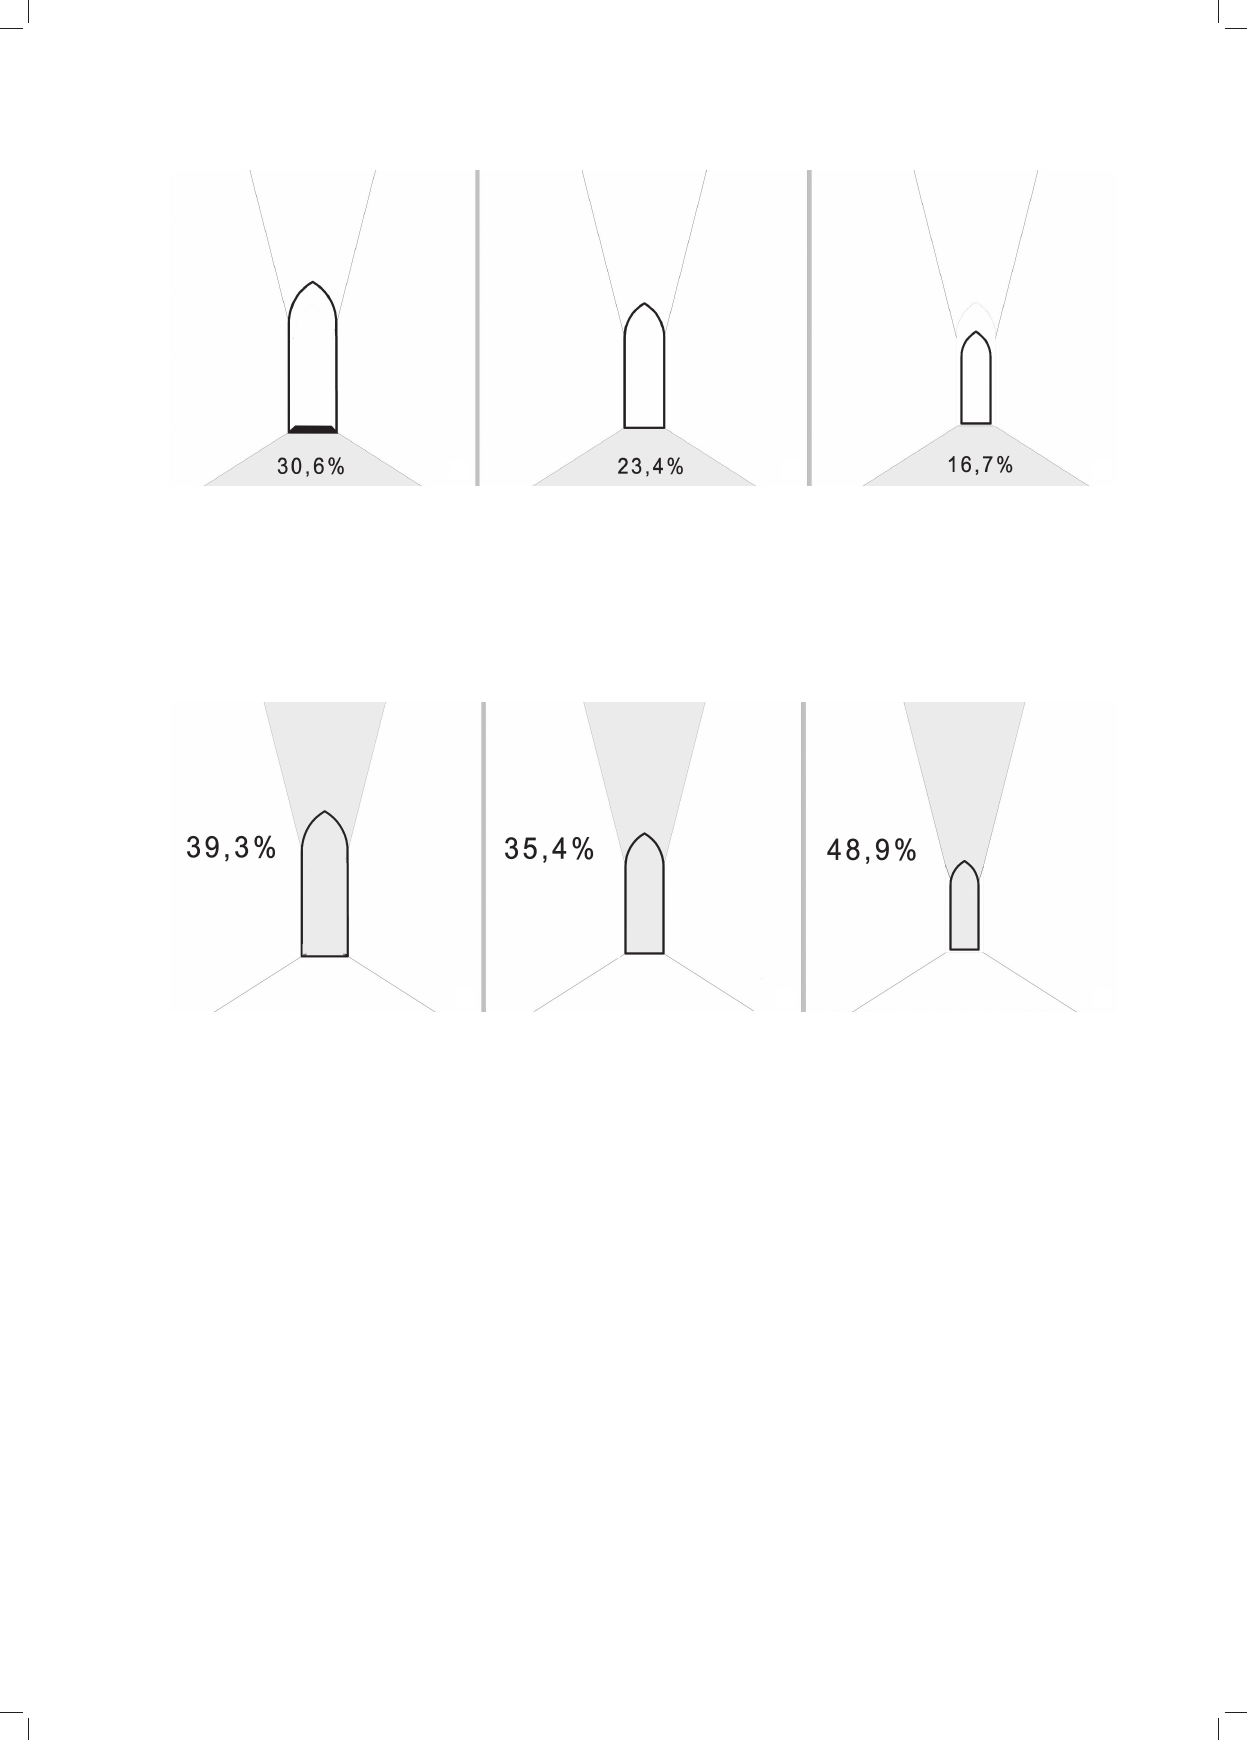
zacji wolontariusze poświęcali 30,6% czasu (A), poprzez
24.9 places of attention concentration. For the other two
examples, A and B, exactly the same value of 29.2 fixa
tions was obtained. Becoming familiarized with the long
est example is therefore a bit “calmer” than with the
shorter examples (Table 1).
In the case of the presbytery closest to the observer, the
number of fixations devoted to its observation is greater
than in the next examples and is probably connected with
a desire to see the detail. During the observation of presby
tery A, an average of 9.2 fixations were made. These fixa
tions are the shortest, an average of 241 ms. The presbytery
in examples B and C, although it was observed by means
of a similar number of 6.6 fixations, differs in the dynamics
of fixation. In the average example, for the entire zone con
taining the presbytery and resulting from the transforma
tion of the wall and the vault, the duration of fixation in
creased up to 312 ms. Most calmly, by performing fixations
lasting up to 378 ms – the presbytery was observed in the
third example, where the nave was the longest. It is a time
increased even by 57% compared to the short example of
the cathedral. Parameters of the fixation show the “visual
magnetism” of the altar which closes the tunnel interior,
especially in the case of its distance from the observer.
Tabela 1. Zestawienie najbardziej istotnych parametrów (oprac. M. Rusnak)
Table 1. List of most important parameters (by M. Rusnak)
A
Wizualizacja
krótkiej katedry
Visualization of
the short cathedral
B
Wizualizacja katedry
o przeciętnej długości nawy
Visualisation of
the cathedral with
the average nave length
C
Wizualizacja
długiej katedry
Visualisation of
the long cathedral
Cała
ilustracja
Whole
illustration
liczebność grup
group size
23 osoby 31 osób 22 osoby
liczba fiksacji na całej ilustracji
the number of fixations
in the whole illustration
29,2 29,2 24,9
Sklepienie
Vault
trwanie uwagi wizualnej,
czas spędzony na sklepieniu
duration of visual attention,
time spent on the vault
9,0% 15,0% 18,2%
Filary
Pillars
trwanie uwagi wizualnej,
czas spędzony na filarach po obu stronach
duration of visual attention,
time spent on pillars on both sides
30,1% 41,2% 34,4%
w tym: lewa strona / prawa strona
including: left side / right side
17,1 / 13,0% 22,5% / 18,7% 18,4% / 16,0%
Prezbiterium
Presbytery
czas poświęcony na poznanie prezbiterium
time devoted to familiarising
with the presbytery
30,3% 20,4% 30,7%
liczba fiksacji / długość fiksacji
number of fixations / length of fixation
9,2 / 241 ms 6,6 / 312 ms 6,6 / 378 ms
czas do pierwszej wizyty
time till the first visit
113,6 ms 34,1 ms 22,8 ms
Inne
Others
trwanie uwagi wizualnej dla pozostałych
elementów: podłoga, ławki, ludzie
duration of visual attention for
the remaining elements: floor, pews, people
30,6% 23,4% 16,7%
w tym (poza ilustracją)
including (not in the illustration)
(5,1%
)
(3,2%) (1,2%)
Kościół tunelowy w badaniach okulograficznych /Funnel church in eye tracking research 81
23,4% (B) do 16,7% (C) (il. 5). To dodatkowo ujawnia
skłonność do większego skupienia uwagi na zakończeniu
nawy przy jej wydłużaniu.
Znaczne wydłużanie układu zwiększyło koncentrację
obserwujących na centralnie położonych architektonicz
nych elementach układu. Pomimo najmniejszej powierzch
ni pola uwagi wizualnej AOI osiągnęły one poziom
niemal
połowy czasu przeznaczonego przez uczestników ekspe
rymentu na zapoznanie się z ilustracją (il. 6).
Interpretacja. Wnioski
Dopiero patrząc na podane powyżej parametry fiksa
cji, można stwierdzić, iż w pełni potwierdziło się przy
puszczenie badaczy dotyczące występowania zjawiska
tak zwanego efektu kościoła tunelowego. Pokazuje to, że
Moreover, attention should be paid to the fact that al
though the illustrations have the same appearance of
the floor, pews and shadows showing the scale of the figure
relative to the interior architecture, the time devoted to
these elements decreased as the presbytery became more
distant from the observer. Initially, to familiarize them
selves with these parts of the visualization, volunteers de
voted 30.6% of time (A), through 23.4% (B) up to 16.7%
(C) (Fig. 5). This additionally reveals a tendency to concen
trate more on the nave’s end when it is extended.
A significant extension of the layout increased concen
tration of observers on the centrally located architectural
elements of the layout. Despite the smallest surface field
of AOI visual attention, they reached the level of almost
half of the time that was used by the participants to famil
iarize themselves with the illustration (Fig. 6).
Il. 5. Porównanie zmian uwagi wizualnej (dwell time) poświęcanej na poznawanie posadzki, ław, postaci ludzkich
oraz czasu spędzonego na wodzeniu wzrokiem poza obrębem ilustracji, kolejno A, B i C (oprac. M. Rusnak)
Oznaczenia kolorystyczne pól: jasnoszary – wartość referencyjna, czarny – wzrost wartości, ciemnoszary – spadek wartości (oprac. M. Rusnak)
Fig. 5. Comparison of dwell time on observing the floor, the benches, the human shapes
and on looping outside the frame of the illustration in examples A, B, C (by M. Rusnak)
Colors markings: light gray – reference value, black – increase in value, dark gray – decrease in value (by M. Rusnak)
Il. 6. Porównanie zmian uwagi wizualnej (dwell time) poświęcanej na poznawanie centralnych elementów architektonicznych:
sklepienia i prezbiterium (oprac. M. Rusnak)
Oznaczenia kolorystyczne pól: jasnoszary – wartość referencyjna, czarny – wzrost wartości, ciemnoszary – spadek wartości (oprac. M. Rusnak)
Fig. 6. Comparison of dwell time on observing the vaults
and the presbytery (by M. Rusnak)
Colors markings: light gray – reference value, black – increase in value, dark gray – decrease in value (by M. Rusnak)
C
C
A
A
B
B

82 Marta Rusnak, Piotr Chmielewski, Joanna Szewczyk
Interpretation. Conclusions
Only after analysing the parameters of fixation given
above, can it be stated that the researchers’ assumption
re garding the occurrence of the phenomenon of the so
called tunnel church effect was fully confirmed. This
shows that extending the nave reflects the metaphysical
hierarchy of this architectural layout more strongly. In the
case of visualization of the longest cathedral, viewers got
interested in the presbytery the fastest, and their observa
tions were the least dynamic. The experiment proved that
the extension of the nave of the church supports concen
tration of people’s attention who are in the temple in ac
cordance with the expectations of the liturgy which is
celebrated mainly within the presbytery.
Further research perspectives
An eye tracker turns out to be an interesting tool for
researching architectural monuments. Thanks to the im
plementation of this technology, it was again possible to
observe the specific aspect of the evolution of the Gothic
cathedral structure, although it was much simplified. In
this respect, describing the mechanism that governs the
perception of the main nave of a church as a tunnel inte
rior seems extremely interesting. However, it would be
really of great significance to verify the research which
was carried out with the use of a stationary eye tracker
and the stimuli used in the described experiment, which
were presented on the monitor screen by applying visu
alisations that were presented in the technology of spher
ical photos and an eye tracker coordinated with the vir
tual reality environment. The authors would like to
extend their studies in the future, both by increasing the
research group and by introducing other intermediate
phases in the changing length of Gothic churches. This
would allow us to obtain more precise statistical param
eters as well as to draw conclusions from longer numeri
cal sequences.
Translated by
Bogusław Setkowicz
wy dłużanie nawy silniej oddaje metafizyczną hierarchię
tego układu architektonicznego. W przypadku wizuali
zacji najdłuższej katedry widzowie interesowali się pre
zbiterium najszybciej, a ich obserwacje były najmniej
dynamiczne. Eksperyment udowodnił, że wydłużenie
nawy kościoła wspiera koncentrację uwagi ludzi przeby
wających w świątyni zgodnie z oczekiwaniami liturgii,
sprawowanej głównie w obrębie prezbiterium.
Dalsze perspektywy badawcze
Okulograf okazuje się interesującym narzędziem do
badań zabytków architektury. Dzięki wdrożeniu tej tech
nologii było możliwe ponowne, choć znacznie uproszczo
ne przyglądnięcie się konkretnemu aspektowi ewolucji
struktury katedry gotyckiej. Pod tym względem opisanie
mechanizmu rządzącego postrzeganiem głównej nawy ko
ścioła jako wnętrza tunelowego wydaje się niezwykle in
teresujące. Warto by jednak było badania przeprowadzone
za pomocą okulografu stacjonarnego i wykorzystanych
w opisanym eksperymencie bodźców prezentowanych
na ekranie monitora zweryfikować, używając wizualiza
cji prezentowanych w technologii zdjęć sferycznych oraz
okulografu skoordynowanego ze środowiskiem wirtual
nej rzeczywistości. Autorzy chcieliby w przyszłości roz
szerzyć studia, zarówno zwiększając grupę badawczą, jak
i wprowadzając inne, pośrednie fazy w zmieniającej się
długości kościołów gotyckich. Pozwoliłoby to na uzyska
nie dokładniejszych parametrów statystycznych oraz na
wyciąganie wniosków z dłuższych ciągów liczbowych.
Bibliografia /References
[1] Żórawski J., Siatka prostych. O architekturze nadindywidualnej,
Wydawnictwo PK, Kraków 2012.
[2] Spruta J., Mistyka katedry gotyckiej. Architektura sakralna jako
obraz i symbol postawy modlitewnej, „Studia Gnesnensia” 2014,
T. 28, 231–239.
[3] Duby G., Czasy katedr. Sztuka i społeczeństwo 980–1420, tłum.
K. Dolatowska, PIW, Warszawa 2002.
[4] Norman E., Dom Boga. Historia architektury sakralnej, Arkady,
Warszawa 2007.
[5] Walczak R., Symbolika i wystrój świątyni chrześcijańskiej, Wy
daw nictwo Święty Wojciech, Poznań 2005.
[6] Simson O. von, Katedra gotycka. Jej narodziny i znaczenie, tłum.
A. Palińska, PWN, Warszawa 1989.
[7] Bałus W., Gotyk bez Boga? W kręgu znaczeń symbolicznych archi
tektury sakralnej XIX wieku, Wydawnictwo Naukowe UMK, Toruń
2011.
[8] ErlandeBrandenburg A., MérelBrandenburg A.B., Histoire de l’ar
chitecture Française. Du moyen Age à la Reinaissance, Menges,
Paris 1995.
[9] HenryClaude M., Stefanon L., Zaballos Y., Principes et éléments
de l’architecture religieuse médievale, Fragile, Gavaudun 1997.
[10] Panofsky E., Architecture gothique et pensée scolastique précédé de
L’abbé Suger de SaintDenis, Les Edition de Minuit, Alen çon 1992.
[11] Bogdan M., Definicja piękna w XII wieku a architektoniczna eks
pozycja ołtarza w epoce gotyckiej, „Polonia Sacra” 2013, vol. 17,
nr 2(33), 277–297.
[12] https://www.smivision.com/ [accessed: 1.06.2017].
[13] Holmqvist K., Nystöm M., Anderson R., Dewhurst R., Jarodz
ka H., van de Weije J., Eye tracking. A comprehensive guide to
methods and measures, Oxford University Press, Oxford 2011.
[14] Duchowski A.T., Eyetracking methodology. Theory and practice,
Springer, London 2007.

Kościół tunelowy w badaniach okulograficznych /Funnel church in eye tracking research 83
Podziękowania
Autorzy artykułu serdecznie dziękują prof. dr hab. inż. arch. Małgorzacie
Chorowskiej oraz dr Aleksandrze Marcinów za konsultacje w czasie
przygotowania wizualizacji wnętrz katedr. Asystą techniczną i radą przy
przeprowadzaniu badania służyła nam mgr inż. Ewa Ramus – reprezen
tująca Neuro Device Group. Ponownie dziękujemy dr inż. arch. Ag niesz
ce Gryglewskiej, mgr inż. arch. Małgorzacie Budlewskiej – doktorantce
Wydziału Architektury Politechniki Wrocławskiej – oraz Kołu Nauko
wemu ArcHist.
Acknowledgements
We would like to thank Prof. dr hab. inż. arch. Małgorzata Chorowska
and dr inż. arch. Agnieszka Marcinów for consultations during the pre
paration of the visualisation of cathedrals’ interiors. Mgr inż. Ewa
Ramus – representing Neuro Device Group, was our technical assistant
and ad viser when conducting the research. Again, we thank dr inż. arch.
Ag nieszka Gryglewska, mgr inż. arch. Małgo rzata Budlewska, PhD
student in WA and the members of the ArcHist Scientific Club.
Streszczenie
Tekst stanowi drugą z trzech części raportu dotyczącego sondażu okulograficznego przeprowadzanego w 2017 r. w Katedrze Historii Architektury,
Sztuki i Techniki na Wydziale Architektury Politechniki Wrocławskiej. Badania dotyczyły charakterystyki zapoznawania się z zabytkowymi budow
lami. Pierwsza część omawiała zarejestrowany przez autorów sposób zapoznawania się z głębią nawy głównej kościoła gotyckiego. Podobnie jak
w poprzednim artykule, także w niniejszej pracy na potrzeby eksperymentu wykorzystano wizualizacje XIII i XIVwiecznych katedr francuskich.
Autorów interesowało, na ile długość nawy głównej gotyckiej katedry przekłada się na percepcję całego układu oraz czy i kiedy obserwatorzy są
bardziej skłonni do koncentracji swojej uwagi wzrokowej, identyfikując prezbiterium. Zjawisko, w którym wraz ze wzrostem długości nawy
światyni wzrok człowieka jest znacznie mocniej przyciągany przez strefę prezbiterialną, nazywa się także efektem kościoła tunelowego.
Słowa kluczowe: okulografia, katedra gotycka, percepcja architektury, kościół tunelowy, prezbiterium
Abstract
This paper constitutes the second part of a threepart report considering an eyetracking survey that took place in 2017 at the Department of History
of Architecture, Art and Technique at the Wrocław University of Science and Technology. The study focused on how people perceive historic build
ings. The first part of the report discussed the way people perceive the depth of the nave of a Gothic church. In the second part the researchers were
interested in how the length of the nave affects the perception of the entire layout of the church and in what circumstances the observers are most
willing to pay attention to the area of the presbytery. The survey included the testing of the socalled tunnel church effect theory, according to which
the longer the nave, the more attention is paid to the presbytery.
Key words: eye tracking, Gothic cathedral, perception of architecture, funnel church, presbytery
[15] Francuz P., After Imagia, Lublin 2012, http://afterimagia.pl/book/
[accessed: 11.05.2017].
[16] Onians J., Neuroarthistory. From Aristothele and Pliny to Baxan
dall and Zeki, Yale University Press, Yale 2008.
[17] Kędziora Ł., Niezauważalna i rewolucyjna neurohistoria sztuki,
„Acta Universitatis Nicolai Copernici. Zabytkoznawstwo i Kon
ser watorstwo”, Nr 45, UMK, Toruń 2014, 223–252.
[18] FolgaJanuszewska D., Muzeologia neuronalna. Inne spojrzenie na
muzeum XXI wieku, [w:] E. Kowalska, E. Ur ba niak (red.), Muzeum
XXI wieku. Teoria i praxis. Materiały konferencji
Muzeum Począt
ków Państwa Polskiego, Gniezno, 25–26 listopada 2009, Muzeum
Początków Państwa Polskiego, Gniezno 2010, 29–35.
[19] Rusnak M., Fikus W., Szewczyk J., Jak obserwatorzy postrze
gają głębię we wnętrzu gotyckiej katedry wraz ze zmianą jej pro
porcji? Sondaż okulograficzny, „Architectus” 2018, Nr 1(53),
77–88.
Wizualizacja z projektu D. Oleś
Visualization from the project by D. Oleś