
2024
4(80)
Agnieszka Ptak-Wojciechowska*
Use of the Analytic Hierarchy Process (AHP) method
to assess the urban quality of life of seniors in terms
of architectural and urban planning aspects
DOI: 10.37190/arc240409
Published in open access. CC BY NC ND license
Abstract
Cities should aim to provide a high quality of life (QoL) for all residents. However, the urban structure often fails to meet the spatial needs of
senior citizens, despite ongoing demographic changes. Furthermore, there is a lack of scientic assessment instruments that could be used to evaluate
the architectural and urban aspects of a city and guide improvements. Although popular urban rankings may be used for urban policy development,
their results are often misinterpreted by their recipients. The use of multi-criteria decision-making (MCDM) methods can facilitate the process of
comparing city areas, increase the transparency of the evaluation, and involve dierent stakeholders in the evaluation process. Machine learning
(ML) could be an interesting extension to commonly used statistical methods. This paper presents the latest research methods on the urban QoL of
seniors, using a multi-criteria analysis of ve neighbourhoods in Poznan as an example. The Analytic Hierarchy Process (AHP) method is discussed
as part of the author’s tool for measuring the perceptual assessment of senior citizens and the expert assessment of architects and urban planners, in
terms of functional and spatial aspects. The AHP method’s eectiveness is demonstrated, and the results can support city authorities, designers, and
researchers. Additionally, this research presents directions for its development using ML methods.
Key words: participatory methods, multi-criteria methods, quality of life in cities, machine learning, ageing societies
Introduction
According to projections, the number of people aged
65 and over worldwide will be around 16% of the popu-
lation in 2050 (United Nations 2022), and the number of
urban dwellers will account for two-thirds of the popula-
tion (United Nations 2020). Climate change and its nega-
tive impacts threaten people’s lives, health and property
(Hoornweg, Sugar, and Trejos Gómez 2011). Cities are
inuential in amplifying the eects of storms, heavy rain-
fall and heat waves (Pörtner et al. 2022), and the shaping
of urban space has an undeniable impact on quality of life
(Wojnarowska 2016). Urban quality of life (QoL) assess-
ment tools (e.g., guidelines, rankings) are considered to
have potential in the context of urban planning and policy
(Lowe et al. 2015). The rationale for addressing the top-
ic was the observation of the inadequacy of urban spaces
to meet the needs of older people and the popularity of
instruments for its evaluation, such as city rankings. The
results of rankings to identify the best places to live attract
the attention of the media and communities, as well as city
authorities around the world, even though most of the tools
were not intended to inuence policy. The current and pop-
ular tools vary considerably, even though they all seem to
touch on the topic of quality of life. The dierences relate
to the commissioning bodies, the methodology, the focus
groups, the target groups of the surveys and the criteria
studied. Cities around the world, but also within one coun-
try, dier signicantly, and yet they are still subject to very
uniform evaluation criteria in rankings. The analysed glob-
al evaluation tools do not take into account that the quality
of life diers depending on the location of residence within
the same city, but for example in other neighbourhoods.
An important motivation in taking up the chosen topic
is the approach that assumes that in assessing the quality
of life in cities, more attention should be paid to subjective
*
ORCID: 0000-0002-4833-905X. Faculty of Architecture, Poznan
University of Technology, Poland, e-mail: agnieszka.ptak-wojciechowska
@put.poznan.pl

86 Agnieszka Ptak-Wojciechowska
between objective measures of quality of life and subjec-
tive measures is weak, and the author argues for more at-
tention to be paid to subjective indicators of quality of life.
Other researchers present an integrated approach using
GIS (Geographic Information System)
1
and multi-criteria
decision making/aiding (MCDM/A) methods to assess the
quality of urban open spaces in Milan. The authors pro-
pose criteria and sub-criteria covering features of the built
environment, its organisation and the perception of users.
Data to complete the individual indicators were obtained
from GIS, Open Street Map and Google Maps, as well
as through direct observation (Oppio et al. 2021). Also,
researchers from Poland point out the need to extend so-
cial and economic indicators to include subjective aspects
related to the opinion of the inhabitants and, in addition,
to use geographical research methods (e.g., geo-survey
2
)
(Czepkiewicz, Jankowski 2015). Quality of life can be
narrowed down to its individual criteria – for example,
accessibility of space. Other authors propose a Decision
Support System (DSS) and a conditioned tool – the on-
line Walkability Explorer (WE) application to support
design and planning for assessing the walkability and
accessibility of a space for pedestrians. The researchers
present a case study in which they discuss the results of
an example application in the Lisbon area (Blečić et al.
2015). Models are proposed to assess the age-friendliness
of cities, such as Best Cities for Successful Aging. This
tool evaluates the spaces of US metropolitan areas against
nine categories and 83 indicators, and aims to highlight
and encourage good practices that improve the quality
of cities and the quality of life of residents (Kubendran,
Soll, and Irving 2017). In turn, the report commissioned
by UNECE and DG EMPL gives numerous examples of
the use of the Active Ageing Index (AAI), its practical in-
strument for identifying areas where appropriate policies
can harness the active potential of older people. The index
is multidimensional, and environmental factors, includ-
ing infrastructure to promote well-being, social cohesion
and digitalisation, among others, are taken into account.
Twenty-eight countries in the European Union joined the
survey, plus Iceland, Switzerland and Canada (Lamura,
Principi 2019). A methodology for assessing the quality of
life of older adults on a suburban scale is also available, in-
tegrating objective indicators, derived from statistical data,
and subjective indicators, taking into account the opinions
of both experts and older people (Garcia et al. 2017). In
addition, a study based on the Survey of Health, Aging,
and Retirement in Europe (SHARE) is worth mentioning.
The study analysed the direct impact of perceived acces-
sibility on the quality of life of 13,828 Europeans aged 65
and over and the indirect impact after taking into account
aspects related to loneliness, place attachment, marital
status and functional disability (Vitman Schorr, Khalaila
2018). Of interest is the analysis of older people’s sense
1
Geographic Information System – is used to collect, visualize and
process geographic data, as well as support the decision-making process.
2
Geosurvey, as one of the forms of conducting online public con-
sultations, is used during the spatial planning process. In this form, re-
spondents provide answers using maps.
indicators regarding residents’ perceptions, and that a com-
plete tool should examine both objective and subjective
aspects (Gawlak, Matuszewska, and Ptak 2021).
The motivation for undertaking the research is the diag-
nosed research gaps. In an analysis of a selection of current
tools for assessing quality of life in cities, it was shown that
global challenges (climate and demographic change) are
overlooked in many of them, and that aspects of the spatial
(architectural-urban) quality of cities and the importance
of perceptual assessment are underestimated. Comparisons
of places to live are global – they apply to entire cities
– and should also be local. Indeed, the study of urban qual-
ity should also include neighbourhood units representing
an intermediate urban scale: larger than a single building
with its immediate surroundings and smaller
than the en-
tire city within its administrative boundaries. Moreover,
seniors use cities locally and their activities are most often
narrowed down to their at and immediate neighbourhood
(Garau, Pavan 2018). Assessment tools are too general and
ambiguous. Rankings should serve as a good example – not
a source of competition. A city ranking system and gover-
nance should be well linked (Ptak-Wojciechowska 2023).
The aim of the research presented in this article was to
formulate guidelines for the denition of an assessment tool
taking into account spatial aspects, expert and perceptual
evaluation, in addition to sustainability principles and so-
cio-cultural context. The guidelines were created on the ba-
sis of a comparative analysis of selected current assessment
tools. It was crucial to select a transparent methodology.
The following research hypothesis was formulated: The
development of tools for assessing urban quality of life
should include participatory methods involving research-
ers, experts and residents. These tools need to take into
account more criteria related to aspects of the shaping of
the spatial structure of cities. In addition, they should be
adapted to the demographic context, local conditions and
global environmental risks.
The research problem related to the inadequacy of ur-
ban spaces and tools for assessing urban quality of life
to current challenges is also presented. The latest meth-
ods and techniques used in urban quality of life research
are then discussed. This is followed by a presentation of
the author’s own research, with particular emphasis on
the selection of a multi-criteria method and the process
of constructing the author’s urban assessment tool. This
is followed by a demonstration of the verication of the
tool, including expert and perception surveys, as well as
the nal ranking of neighbourhoods. The last part includes
a summary, involving recommendations for continuing re-
search using machine learning methods.
State of research
Quality of life is studied both in Poland and internation-
ally in various ways. For example, researchers’ attention
is drawn to the importance of the interrelationship of ob-
jective and subjective measures. Adam Okulicz-Kozaryn
(2013) examines the relationship between Mercer’s
Quality of Living Ranking and survey data from a satis-
faction survey. According to the analysis, the relationship

Use of the Analytic Hierarchy Process (AHP) method to assess the urban quality of life of seniors 87
of safety in the context of the built environment, for which
the starting point was the framework of age-friendly cities
and the quality of life aspect of neighbourhoods (Donder et
al. 2013). There is also interdisciplinary research on the re-
lationship between the health of ageing Australians and ur-
ban sustainability. The authors present a method to explore
the relationship between subjective and objective mea-
sures of built environment characteristics of settlements
(number of buildings, street capacity and connectivity, di-
versity of functions, continuity of elevations, number of
seats) and health for communities of people aged 55 years
and older (Brewer et al. 2014).
Description of original research
The original research was conducted between 2020 and
2023. The study adopted a specic methodology. In the
rst part, the method of logical argumentation was used.
A literature analysis was carried out to be able to identify
the state of the art of the global challenges faced by cit-
ies (climate change, demographics and urbanisation), the
measurement of quality of life in spatial terms, current
tools for assessing urban quality of life and their classi-
cation, in addition to architectural, universal and inclusive
design. This was followed by a quantitative and qualitative
study of the available assessment tools. Statistical tech-
niques and comparative studies were used, as described
in more detail in the dissertation (Ptak-Wojciechowska
2023). A selection of spatial criteria and sub-criteria, ex-
tracted from the analysed existing tools, was then made.
The synthesis was done according to the recommendation
formulated from Miller’s gure that the number of ele-
ments within the model groups should be 7 ± 2 (Miller
1956). The dened criteria and sub-criteria were subject-
ed to expert evaluation by collating and comparing them.
Subsequently, a mathematical multi-criteria method was
applied. The nal stage was quantitative and qualitative
participatory research.
Literature research, criteria for the selection of tools
The subject of the study were publicly available evalua-
tion instruments, both international and Polish. Documents
that meet the specied eligibility have been selected on the
basis of literature and keyword research as well as rec-
ommendations of experts in the eld of design for seniors
(who are both researchers and practicing architects), as
well as creators of other comparative analyses. Eligibility
was related to the scope of the study (including quality of
life in cities, age-friendliness and spatial indicators) and
the characteristics of the indicators included (Fig. 1).
Comparative analysis of tools
The comparative research included an analysis of 24
tools created in the years 2007–2021, such as: rankings
(selecting the best locations to live), guides (measuring
accessibility for seniors), other Polish instruments (taking
into account surveys and assessing the quality of life using
a set of indicators), as well as assessment models proposed
by the researchers. The set of assessment tools consists of
three international guides and one Polish guideline, 13 in-
ternational rankings, and two Polish and ve other Polish
tools (Table 1), as well as 14 models proposed by scientists
(Table 2) (Ptak-Wojciechowska 2023).
Comparative research revealed that in most Polish as-
sessment tools and rankings, aspects related to the aging
of societies were not taken into account in detail. Issues
related to population ageing have been given special at-
tention in the guides created to study the accessibility of
cities for the elderly and in two rankings “Best Cities for
Successful Aging” and “Active Ageing Index” on similar
topics, as well as in the Polish study “Jak się żyje osobom
starszym w Polsce” [How do older people live in Poland].
In 16 tools, on the other hand, the aspect of demographic
change was included, among other things, by providing
information on life expectancy and taking into account
dierent age ranges when analysing the results. Despite
environmental threats, water and climate aspects were not
included in the assessment at all in the Polish and foreign
guides. Indicators assessing climate aspects were included
in 5% in international rankings, 6% in Polish rankings and
1% in other Polish tools, and water-related metrics – only
in 3% in international rankings, in 1% in Polish rankings
and 0.6% in other Polish tools (detailed data can be found
in Ptak-Wojciechowska 2023).
Fig. 1. Criteria for the selection of representative tools (elaborated by A. Ptak-Wojciechowska)
Il. 1. Kryteria wyboru narzędzi reprezentatywnych (oprac. A. Ptak-Wojciechowska)

88 Agnieszka Ptak-Wojciechowska
Tool No. Name Contracting Authority Source
International guides
1.1 Global Age – friendly Cities – A Guide World Health Organisation
(World Health Organization
2007)
1.2
Measuring the age-friendliness of cities.
A guide to using core indicators
World Health Organisation
(World Health Organization
2015)
1.3
Age-friendly rural
and remote communities: a guide
Federal/Provincial/Territorial
Ministers Responsible for Seniors
(Federal/Provincial/Territorial
Ministers Responsible
for Seniors 2007)
Polish guides 1.4
System wsparcia osób starszych
w środowisku zamieszkania – przegląd
sytuacji, propozycja modelu. Synteza
[A system of support for the elderly
in a residential environment
– an overview of the situation and
a proposal for a model. Synthesis]
Rzecznik Praw Obywatelskich
(RPO)
(Błędowski et al. 2016)
International
rankings
2.1 EIU’s Global Liveability Index The Economist Intelligence Unit
(The Economist Intelligence
Unit 2019)
2.2 Mercer’s Quality of Living Ranking Mercer (Mercer 2019)
2.3 Monocle’s Quality of Living Survey Monocle (Monocle 2019)
2.4 Deutsche Bank Liveability Survey Deutsche Bank AG/London (Reid, Nicol, and Allen 2019)
2.5 Euro Health Consumer Index Health Consumer Powerhouse (Björnberg, Phang 2019)
2.6 IMD Smart City Index
IMD World Competitiveness
Center’s Smart City Observatory
Singapore University of
Technology and Design (SUTD)
(IMD World… 2019)
2.7 Best Cities for Successful Aging
Milken Institute Center for the
Future of Aging Milken Institute
Research Department
(Kubendran, Soll,
and Irving 2017)
2.8 Human Development Report
United Nations; Human
Development Report Office
(United Nations Development
Programme 2019)
2.9 Quality of life (well-being of Europeans) Eurostat (Eurostat 2017)
2.10
The European Quality of Life Survey (EQLS)
Eurofound (Eurofound 2017)
2.11 How’s Life? 2020 Measuring Well-being OECD
(Organisation for Economic
Cooperation and Development
2020)
2.12
Quality of life in cities. Perception survey
in 79 European cities
European Commission (European Commission… 2013)
2.13 Active Ageing Index
UNECE + DG EMPL
(European Commission)
(Lamura, Principi 2019)
Polish rankings
2.14
Ranking jakości życia. Wymiary szczęścia
[Quality of life ranking. Dimensions
of happiness]
POLITYKA and the AGH
University of Science
and Technology
(Polityka and Akademia
Górniczo-Hutnicza 2018)
2.15
Uciekające metropolie. Ranking 100
polskich miast [Runaway metropolises.
Ranking of 100 Polish cities]
Klub Jagielloński (Wałachowski, Król 2019)
Other Polish
appraisal
instruments
3.1
Jakość życia w Polsce. Edycja 2017
[Quality of life in Poland. 2017 Edition]
Główny Urząd Statystyczny (GUS) (Bendowska et al. 2017)
3.2
Zadowolenie z życia
[Life satisfaction]
Centrum Badania Opinii
Społecznej (CBOS)
(Centrum Badania Opinii
Społecznej 2020)
3.3
Diagnoza społeczna 2015. Warunki
i jakość życia Polaków
[Social Diagnosis 2015. Conditions
and quality of life of Poles]
Rada Monitoringu Społecznego (Czapiński, Panek 2015)
3.4
Jakość życia mieszkańców Łodzi
i jej przestrzenne zróżnicowanie
[Quality of life of Lodz’s inhabitants
and its spatial diversity]
Urząd Miasta Łodzi (Rokicka 2013)
3.5
Jak się żyje osobom starszym w Polsce
[How do older people live in Poland]
Główny Urząd Statystyczny (GUS)
(Główny Urząd Statystyczny
2012)
Table 1. Summary of current assessment tools analysed:
foreign and Polish guides, international and Polish rankings and other Polish assessment tools (elaborated by A. Ptak-Wojciechowska)
Tabela 1. Zestawienie analizowanych aktualnych narzędzi oceny:
wytycznych zagranicznych i polskich, rankingów międzynarodowych i polskich oraz innych polskich narzędzi oceny (oprac. A. Ptak-Wojciechowska)

Use of the Analytic Hierarchy Process (AHP) method to assess the urban quality of life of seniors 89
Multicriteria methods
On the basis of the comparative analysis, it was noted
that the available tools often use a non-transparent meth-
odology (without indicating the specic sources on the ba-
sis of which the own set of evaluation criteria is created;
without providing data on the number and characteristics
of experts participating in the study; without specifying
how the weights and the aggregate index were calculated)
and that the perspectives of dierent stakeholders (such
as experts and seniors) were not combined. Therefore,
a search was started for a method that would be transpar-
ent and would allow for including various aspects in the
assessment. It was decided to use multi-criteria methods
widely used in decision-making (Afshari, Vatanparast, and
Ćoćkalo 2016). The number of available multi-criteria de-
cision support methods is signicant (over 200), and their
diversity means that the selection of the method itself is
a multi-criteria problem (Trzaskalik 2014).
Method selection
The use of various multi-criteria methods was consid-
ered, both with the help of an expert (a university pro-
fessor and practitioner whose specialization is the use
of multi-criteria decision support methods in urban mo-
bility management) and the Multiple Criteria Decision
Analysis Methods Selection Software (MCDA-MSS
3
)
tool for matching multi-criteria methods to a specic de-
cision problem (Cinelli et al. 2021). Initially, the AHP
and ELECTRE-III-H methods (the so-called Electre with
sub-criteria) were taken into account together with the
expert, while the algorithm resulted in the recommenda-
tion of the MCHP-PROMETHEE method. The practical
aspect, related to the selection of a less complicated and
more understandable method for decision-makers, experts
in the discipline of architecture and urban planning, nal-
ly conrmed the eectiveness of the AHP method (Saaty
1986). The individual stages of the procedure are present-
ed in the diagram (Fig. 2).
3
A tool using many questions (concerning, among others, the type
of problem, the way of ordering, the set of evaluation criteria and its
structure, or the way of measuring the performance of the variant) en-
abling step-by-step rejection of a method that does not meet the criteria
– ultimately leading to the recommendation of methods that meet all
selected assumptions.
Table 2. Set of scientific studies analysed
(elaborated by A. Ptak-Wojciechowska)
Tabela 2. Zestaw analizowanych opracowań naukowych
(oprac. A. Ptak-Wojciechowska)
No. Title Source
1
Developing a checklist for assessing
urban design qualities
of residential complexes
in new peripheral parts
of Iranian cities:
A case study of Kerman, Iran
(Abousaeidi,
Hakimian 2020)
2
Urban design assessment tools:
A model for exploring atmospheres
and situations
(Abusaada, Elshater
2020)
3
Responsive environments:
A manual for designers
(Bentley et al. 2005)
4
Socially sustainable suburbia:
Linking neighbourhood
characteristics to health outcomes
in an ageing population
(Brewer et al. 2014)
5
Towards an urban quality framework:
Determining critical measures
for different geographical scales
to attract and retain talent in cities
(Esmaeilpoorarabi,
Yigitcanlar,
and Guaralda 2016)
6
Assessment of and improvement
strategies for the housing of healthy
elderly: Improving quality of life
(Feng et al. 2018)
7
Evaluating Urban Quality:
Indicators and Assessment Tools
for Smart Sustainable Cities
(Garau, Pavan 2018)
8
Assessment of an urban sustainability
and life quality index for elderly
(Garcia et al. 2017)
9
City planning and population health:
A global challenge
(Giles-Corti et al.
2016)
10
Developing and testing a framework
for the assessment of neighbourhood
liveability in two contrasting countries:
Iran and Estonia
(Maleki et al. 2015)
11
Assessing urban quality: A proposal for
a MCDA evaluation framework
(Oppio, Bottero, and
Arcidiacono 2022)
12
How to assess urban quality:
A spatial multicriteria
decision analysis approach
(Oppio et al. 2021)
13
Model for Assessment
of Public Space Quality
in Town Centers
(Wojnarowska 2016)
14
Neighbourhood sustainability
assessment: Evaluating residential
development sustainability
in a developing country context
(Yigitcanlar,
Kamruzzaman,
and Teriman 2015)
Fig. 2. Tool development process – on a diagram of how multi-criteria decision methods work
(elaborated by A. Ptak-Wojciechowska based on: Kobryń 2014)
Il. 2. Proces tworzenia narzędzia – na schemacie działania metod wielokryterialnego wspomagania decyzji
(oprac. A. Ptak-Wojciechowska na podstawie: Kobryń 2014)
90 Agnieszka Ptak-Wojciechowska
Formulation of criteria and sub-criteria
related to the selection of the variant
A literature analysis of current assessment instruments
and models yielded 2189 metrics. Metrics are understood
as the smallest components for assessing the quality of
life in cities, constituting a component of the sub-crite-
ria. Only those related to the assessment of the spatial
structure aecting quality of life were included. After re-
moving redundancy, 128 relevant metrics were nally ob-
tained. In the course of their analysis, certain relationships
between them were diagnosed – consequently, they were
grouped into sub-criteria
4
. Metrics that were recurrent
4
The grouping was performed and veried by at least two people.
in the various reference materials or non-recurrent, but
proposed in signicant tools/studies, or assessed as high-
ly relevant, were taken into account. The reference tools
were in particular the most inuential publications: the
WHO guides Global Age-friendly Cities. A guide (2007)
and Responsive environments. A manual for designers
(Bentley et al. 2005).
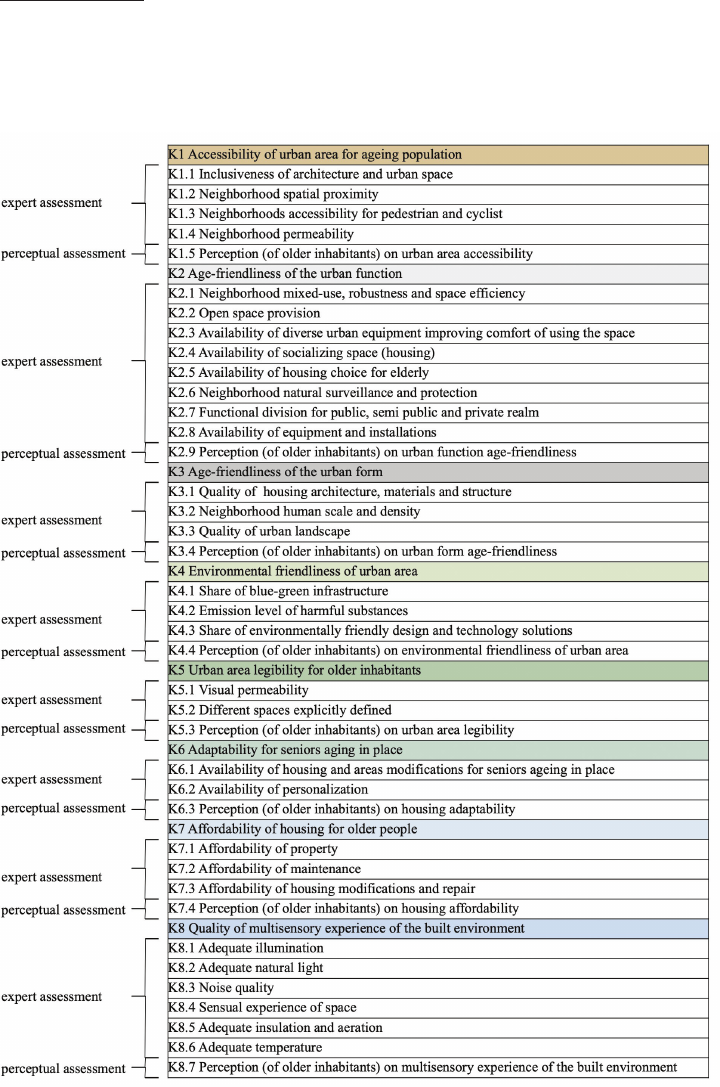
In the end, a list of criteria and sub-criteria was created
that was considered the most eective for the study. The
need for both expert and perceptual evaluation was taken
into account, hence each criterion included sub-criteria for
measurement by experts and one sub-criterion each related
to the subjective evaluation of the residents of the neigh-
bourhoods (Fig. 3). The characteristics of each sub-criteri-
on can be found in the dissertation (Ptak-Wojciechowska
2023).
Fig. 3. Formulation of evaluation
criteria and sub-criteria including
expert and perceptual evaluation
(elaborated by
A. Ptak-Wojciechowska)
Il. 3. Sformułowanie kryteriów
i podkryteriów oceny
z uwzględnieniem oceny
eksperckiej i percepcyjnej
(oprac. A. Ptak-Wojciechowska)
Use of the Analytic Hierarchy Process (AHP) method to assess the urban quality of life of seniors 91
Constructing the tool,
ranking the criteria by importance
The next part of the study consisted of making pairwise
comparisons, according to the AHP multi-criteria method
using the AHP-OS program (Goepel 2018) in order to rank
the criteria and sub-criteria by weight. Ten experts were
invited to the study, of which eight nally participated.
The experts were a group of architects (n = 6) and urban
planners (n = 2) – both scientists and practitioners work-
ing actively in the profession. The experts included people
specialising in designing for ageing societies (n = 2) and in
health care (n = 4).
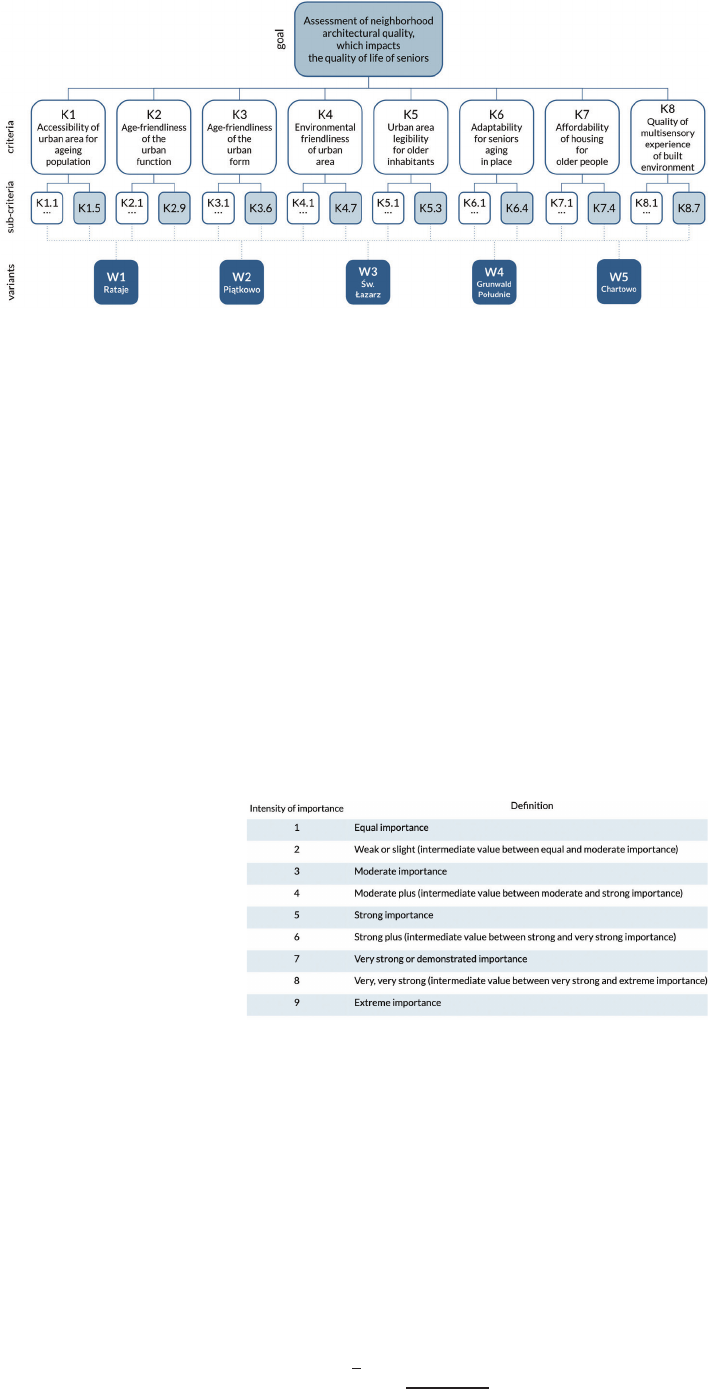
AHP calculation procedure
The initial stage of the calculation procedure for the
AHP method is related to the decomposition of the deci-
sion problem. A hierarchical model is created consisting of
elements such as: overarching goal, criteria, sub-criteria,
decision variants (Fig. 4).
The calculation procedure presented in this article only
concerns the main criteria in order to illustrate the sam-
ple calculations made by the AHP-OS system. It should
be noted that a matrix is constructed at each level of the
AHP model and, as part of the work in AHP-OS, eight
matrices were constructed for the sub-criteria importance
analysis, i.e., there were nine matrices in total. Sample cal-
culations were performed in Google Sheets on the basis
of the individually prepared matrices, the results of which
appeared to coincide with the results of the calculations
in the software by Klaus D. Goepel (2018). However, it
should be emphasised that the specialised tools are more
accurate than the calculations made in Google Sheets, as
obtaining accurate results involves the execution of com-
plex mathematical procedures, and the literature on AHP
shows simplied methods for obtaining similar results
(Stefanów, Prusak 2011). Hence, a slight dierence, e.g.,
in the third digit after the decimal point, is visible in the
results performed by the system and the author of the study
in question.
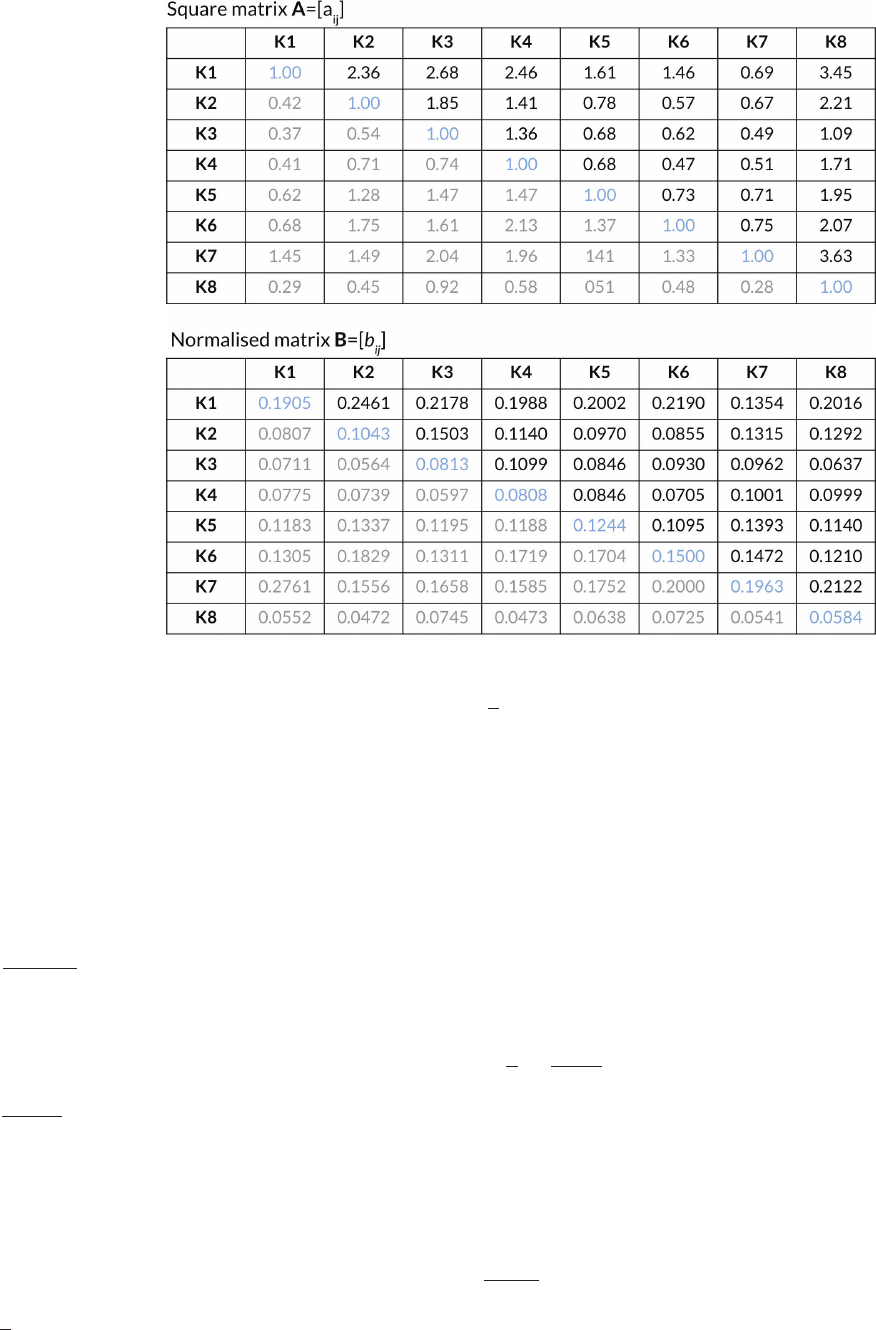
The rst step was to create a comparison matrix A of
dimensions (n × n) (1), where n is the number of criteria
being compared.
(1)
The matrix consists of criteria compared in pairs (K1–
K8) and scores awarded by experts according to the Saaty
scale. On this scale, the higher number of points awarded
by the expert is associated with the greater importance of
the criterion (Fig. 5).
Fig. 4. Hierarchical structure
of the author’s evaluation model
(elaborated by A. Ptak-
Wojciechowska)
Il. 4. Struktura hierarchiczna
autorskiego modelu oceny
(oprac. A. Ptak-Wojciechowska)
According to the principle of inverse preference applied
here, where the rst criterion compared to the second cri-
terion is more important to a certain extent (expressed on
an accepted point scale), the second criterion compared
to the rst criterion is proportionally less important (and
expressed as a fraction). The experts’ preferences were
explored in the form of a questionnaire, in which they
were asked to indicate an advantage individually for each
pair of criteria. Each expert’s individual responses were
then aggregated using a geometric mean expressed by
a formula:
(2)
Fig. 5. The comparison scale of pairwise
(elaborated by A. Ptak-Wojciechowska based on: Saaty 1986)
Il. 5. Skala porównań Saaty’ego
(oprac. A. Ptak-Wojciechowska na podstawie: Saaty 1986)
=
1
1
1
1
1
1
for i, j = 1, 2, …, n
=
…
=
=
2.36
9.5912
= 0.2461
=
1
=
1
8
(0.1905 + 0.2461 + 0.2178 + 0.1988 + 0.2002 + 0.2190 + 0.1354 + 0.2016) = 0.2012
=
1
(
)
CI =
CR =
CI
RI
100%
CI =
(
8.11 8
)
(
8 1
)
= 0.016
CR =
0.016
1.41
= 0.01
CR = 0.01 100% = 1%
=
=
=
= 1
Wzory w artykule
=
1
1/
1
1/
1/
1
for , = 1, 2, … ,
=
…
=
=
2.36
9.5912
= 0.2461
=
1
=
1
8
(0.1905 + 0.2461 + 0.2178 + 0.1988 + 0.2002 + 0.2190 + 0.1354 + 0.2016) = 0.2012
=
1
()
CI =
CR =
CI
RI
100%
CI =
(
8.11 8
)
(
8 1
)
0.016
CR =
0.016
1.41
0.01
CR = 0.01 100% = 1%
=
=
=
1
1/
1
1/
1/
1
for , = 1, 2, … ,
92 Agnieszka Ptak-Wojciechowska
This resulted in a consolidated a
ij
cons
matrix. The next
step was to transform the pairwise comparison matrix
A into a normalised matrix B = [b
ij
] (Fig. 6). For this pur-
pose, the values of the a
ij
cons were summed in the individ-
ual columns of the matrix A = [a
ij
].
Then, the elements appearing in the individual columns
of matrix A were divided by the result of the sum from
the previous step (for example, 2.36/9.5912 = 0.2461)
according to formula (3). The individual elements are
there fore equal:
(3)
where: n – number of elements compared in pairs.
Example calculation:
The matrix has normalized.
In order to determine the weights of the evaluated cri-
teria, the arithmetic mean in each row of the normalized
matrix B was calculated according to the formula:
(4)
Example calculation:
Fig. 6. Consolidated matrix A,
transformed into
normalised matrix B
(elaborated by A. Ptak-
Wojciechowska)
Il. 6. Macierz skonsolidowana A
przekształcona
w macierz znormalizowaną B
(oprac. A. Ptak-Wojciechowska)
In the case of pairwise comparisons by experts, it is pos-
sible that the principle of transitivity of preferences is vio-
lated. If the expert considers the rst criterion more import-
ant than the second and the second criterion more important
than the third, he cannot at the same time consider the rst
criterion less important than the third. The AHP method
allows the consistency of pairwise comparisons to be veri-
ed. For this purpose, it is necessary to determine the max-
imum eigenvalue of the A matrix. In the present study λ
max
was determined according to the formula (Cabała 2018):
(5)
The measures used to assess the consistency of pairwise
comparisons are:
– consistency index (CI) increasing with increasing in-
consistencies in estimates calculated according to the for-
mula:
(6)
where:
λ
max
– maximum eigenvalue of the matrix,
RI – random index dependent on the degree of the ma-
trix n (see Table 3),
n – matrix degree.
Wzory w artykule
=
1
1/
1
1/
1/
1
for , = 1, 2, … ,
=
…
=
=
2.36
9.5912
= 0.2461
=
1
=
1
8
(0.1905 + 0.2461 + 0.2178 + 0.1988 + 0.2002 + 0.2190 + 0.1354 + 0.2016) = 0.2012
=
1
()
CI =
CR =
CI
RI
100%
CI =
(
8.11 8
)
(
8 1
)
= 0.016
CR =
0.016
1.41
= 0.01
CR = 0.01 100% = 1%
=
=
Wzory w artykule
=
1
1/
1
1/
1/
1
for , = 1, 2, … ,
=
…
=
=
2.36
9.5912
= 0.2461
=
1
=
1
8
(0.1905 + 0.2461 + 0.2178 + 0.1988 + 0.2002 + 0.2190 + 0.1354 + 0.2016) = 0.2012
=
1
()
CI =
CR =
CI
RI
100%
CI =
(
8.11 8
)
(
8 1
)
= 0.016
CR =
0.016
1.41
= 0.01
CR = 0.01 100% = 1%
=
=
Wzory w artykule
=
1
1/
1
1/
1/
1
for , = 1, 2, … ,
=
…
=
=
2.36
9.5912
= 0.2461
=
1
=
1
8
(0.1905 + 0.2461 + 0.2178 + 0.1988 + 0.2002 + 0.2190 + 0.1354 + 0.2016) = 0.2012
=
1
()
CI =
CR =
CI
RI
100%
CI =
(
8.11 8
)
(
8 1
)
= 0.016
CR =
0.016
1.41
= 0.01
CR = 0.01 100% = 1%
=
=
=
1
8
(0.1905 + 0.2461 + 0.2178 + 0.1988 + 0.2002 + 0.2190 + 0.1354 + 0.2016) = 0.2012
=
1
8
(0.1905 + 0.2461 + 0.2178 + 0.1988 + 0.2002 + 0.2190 + 0.1354 + 0.2016) = 0.2012
max
=
1
∑
()
=1
Wzory w artykule
=
1
1/
1
1/
1/
1
for , = 1, 2, … ,
=
…
=
=
2.36
9.5912
= 0.2461
=
1
=
1
8
(0.1905 + 0.2461 + 0.2178 + 0.1988 + 0.2002 + 0.2190 + 0.1354 + 0.2016) = 0.2012
=
1
()
CI =
CR =
CI
RI
100%
CI =
(
8.11 8
)
(
8 1
)
0.016
CR =
0.016
1.41
0.01
CR = 0.01 100% = 1%
=
=

Use of the Analytic Hierarchy Process (AHP) method to assess the urban quality of life of seniors 93
The consistency ratio (CR) which is the ratio of the ma-
trix consistency index (CI) to the random index (RI) de-
pending on the degree of this matrix is calculated accord-
ing to the formula:
(7)
Taking into account the maximum value of the matrix
(λ
max
= 8.11) a consistency index has been determined:
And nally, the consistency ratio was calculated:
The calculations presented show that CR < 10% and
therefore pairwise comparisons of the evaluation criteria
are consistent.
It should be emphasised that, thanks to the AHP-OS
system, the expert is automatically informed when his/her
individual answers are inconsistent, so he/she can correct
them at any stage during the completion of the survey.
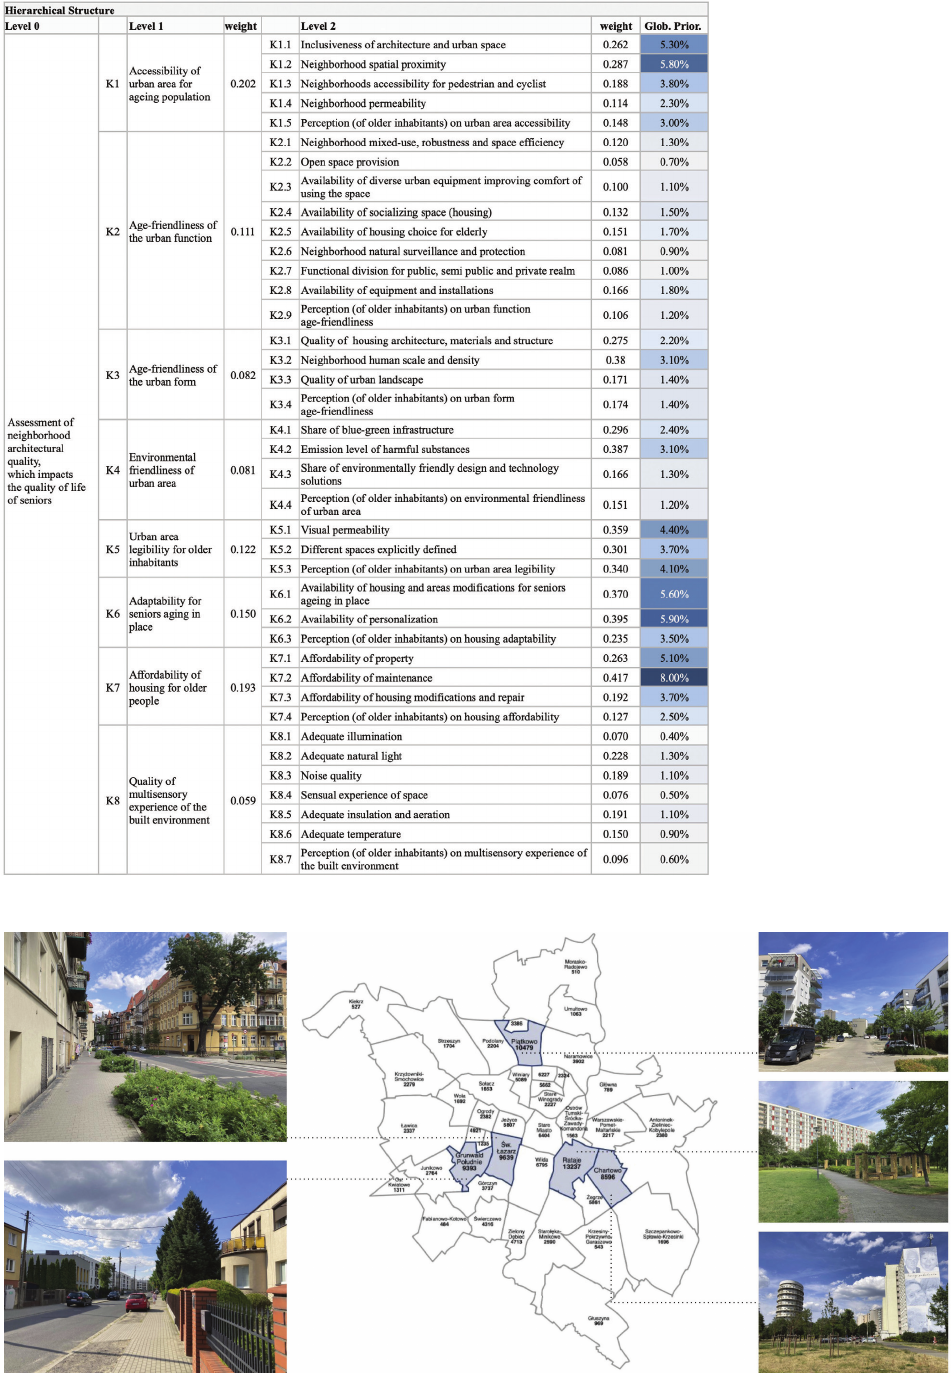
The result of this part of the survey was the weights giv-
en to the individual criteria and sub-criteria and the calcu-
lation of global priorities
5
. The K1: Accessibility of urban
area for ageing population criterion was indicated as the
most important (0.202), then K7: Aordability of housing
for older people (0.193) and K6: Adaptability for seniors
aging in place (0.150). The K8 criterion received the low-
est weight: Quality of multisensory experience of the built
environment (0.059). The share of individual criteria in
percentages is presented in Figure 7.
Tool verification
The stage following the creation of a decision hierarchy
using the AHP method and assigning weights to criteria
and sub-criteria was the verication of the tool. Due to the
argument raised in the literature regarding the validity of
assessing urban quality within the boundaries of neigh-
bouring units instead of within the boundaries of entire
cities, the following variants were indicated: the neigh-
bourhoods of the city of Poznań most frequently inhab-
ited by seniors: Rataje, Piątkowo, Św. Łazarz, Grunwald
Południe, Chartowo (Fig. 8).
5
The global priority presents the average dominance of each of the
(smallest) elements (sub-criteria) over the others in relation to the objective
of the hierarchy; it is the product of the weights for criterion and sub-criterion.
The experts received a research questionnaire consist-
ing of two parts: a table and a legend with a description of
each of the sub-criteria. The table included variants, i.e.,
selected neighbourhoods in the city of Poznań, as well as
their assessment criteria and sub-criteria – all excluding
the sub-criteria concerning the perception of seniors. The
experts were asked to enter a rating for the individual vari-
ants, on a scale of 0–10. The rating was to be assigned to
the neighbourhoods in the individual criteria based on their
own knowledge and experience and the attached support-
ing materials in the form of maps and photos. The group
of experts consisted of eight researchers and practitioners:
architects specializing in designing for the disabled and se-
niors (n = 1), health care (n = 1), as well as in both of these
areas (n = 2), also – architects/historians/urban planners
(n = 2) and architects/urban planners (n = 2).
In parallel with the expert study, a questionnaire survey
was conducted on the perceptual assessment of architec-
ture and urban planning in Poznan according to senior citi-
zens. The survey design underwent a four-stage validation
process. At the rst stage, the survey questionnaire was
analysed and rened on the basis of expert consultation
with a senior citizen. At the second stage, the questionnaire
was further evaluated by a psychologist and a pilot study
was conducted among older people on its readability. At
the third, it received expert approval. The nal stage was
the positive approval of the questionnaire by the Research
Ethics Committee for Studies Involving Humans at Poznan
University of Technology. The survey was anonymous and
took place in stationary and online forms. Ultimately, 198
questionnaires with responses from seniors were taken for
the survey. Seniors were qualied for the survey on the
basis of the age criterion: 60 years and over.
The nal stage of verication was the generation of
the nal ranking of neighbourhoods based on expert and
senior citizen assessments. It should be noted that in the
present study, the stage characteristic of the AHP method,
involving pairwise comparison of options, was abandon-
ed, as in the case of the publication by Edmundas K. Za-
vadskas et al. (2014) and the work of Helder Costa (2017).
The motivation for this decision was the need to combine
expert and perceptual evaluation. In the survey, the senior
citizens commented only on the neighbourhoods they lived
in, while the experts evaluated all ve locations. In addi-
tion, two dierent ordinal scales were included in the sur-
vey. A Likert scale (ratings 1–5), more readable for older
respondents, and a broader scale (ratings 0–10) giving the
experts more freedom of expression. Although it would
have been permissible to translate the aggregated and
standardised scores into pairwise comparisons on Saaty’s
(1986) scale, due to the subjectivity of such a translation
related to the establishment of a class range, the scores
were left as scores.
n 1 2 3 4 5 6 7 8 9 10
Random
index
0 0 0.52 0.89 1.11 1.25 1.35 1.40 1.45 1.49
Table 3. The value of the random index RI (elaborated by A. Ptak-Wojciechowska based on: Saaty 2004)
Tabela 3. Wartość indeksu losowego RI (oprac. A. Ptak-Wojciechowska na podstawie: Saaty 2004)
Wzory w artykule
=
1
1/
1
1/
1/
1
for , = 1, 2, … ,
=
…
=
=
2.36
9.5912
= 0.2461
=
1
=
1
8
(0.1905 + 0.2461 + 0.2178 + 0.1988 + 0.2002 + 0.2190 + 0.1354 + 0.2016) = 0.2012
=
1
()
CI =
CR =
CI
RI
100%
CI =
(
8.11 8
)
(
8 1
)
= 0.016
CR =
0.016
1.41
= 0.01
CR = 0.01 100% = 1%
=
=
Wzory w artykule
=
1
1/
1
1/
1/
1
for , = 1, 2, … ,
=
…
=
=
2.36
9.5912
= 0.2461
=
1
=
1
8
(0.1905 + 0.2461 + 0.2178 + 0.1988 + 0.2002 + 0.2190 + 0.1354 + 0.2016) = 0.2012
=
1
()
CI =
CR =
CI
RI
100%
CI =
(
8.11 8
)
(
8 1
)
0.016
CR =
0.016
1.41
0.01
CR = 0.01 100% = 1%
=
=
Wzory w artykule
=
1
1/
1
1/
1/
1
for , = 1, 2, … ,
=
…
=
=
2.36
9.5912
= 0.2461
=
1
=
1
8
(0.1905 + 0.2461 + 0.2178 + 0.1988 + 0.2002 + 0.2190 + 0.1354 + 0.2016) = 0.2012
=
1
()
CI =
CR =
CI
RI
100%
CI =
(
8.11 8
)
(
8 1
)
0.016
CR =
0.016
1.41
0.01
CR = 0.01 100% = 1%
=
=
Wzory w artykule
=
1
1/
1
1/
1/
1
for , = 1, 2, … ,
=
…
=
=
2.36
9.5912
= 0.2461
=
1
=
1
8
(0.1905 + 0.2461 + 0.2178 + 0.1988 + 0.2002 + 0.2190 + 0.1354 + 0.2016) = 0.2012
=
1
()
CI =
CR =
CI
RI
100%
CI =
(
8.11 8
)
(
8 1
)
= 0.016
CR =
0.016
1.41
= 0.01
CR = 0.01 100% = 1%
=
=
94 Agnieszka Ptak-Wojciechowska
Fig. 7. View after the weights
have been completed by experts
in the AHP-OS programme
(elaborated by
A. Ptak-Wojciechowska)
Il. 7. Widok po uzupełnieniu wag
przez ekspertów w programie
AHP-OS
(oprac. A. Ptak-Wojciechowska)
Fig. 8. Selected variants, i.e., the neighbourhoods in Poznań most populated by senior citizens (elaborated by A. Ptak-Wojciechowska)
Il. 8. Wybrane warianty, czyli osiedla Poznania najliczniej zamieszkane przez seniorów (oprac. A. Ptak-Wojciechowska)
Use of the Analytic Hierarchy Process (AHP) method to assess the urban quality of life of seniors 95
In order to nally rank the variants (neighbourhoods),
a matrix was created consisting of the scores assigned to
each sub-criterion C
j
in the rows and the variants A
i
(alter-
natives) in the columns.
The ratings were then normalised according to the for-
mula (Mathew, Sahu and Upadhyay 2017):
(8)
where: x
j
max
= the maximum possible value of the variant
assessment in a given line (in the case of expert assess-
ments, the maximum value of the rating is 10, and in the
case of senior ratings – 5).
The next stage was to calculate the sum of the products
of weights (global priorities) of the sub-criteria and their
individual normalized values for each neighbourhood, as
well as to rank the preferences in order to obtain the nal
ranking of areas. The nal ranking of preference (P
i
) is
created on the basis of the weighted sum model according
to the formula:
(9)
where:
w
j
– weight of the sub-criterion C
j
,
x
ij
– normalized variant evaluation A
i
for a given
sub-criterion C
j
.
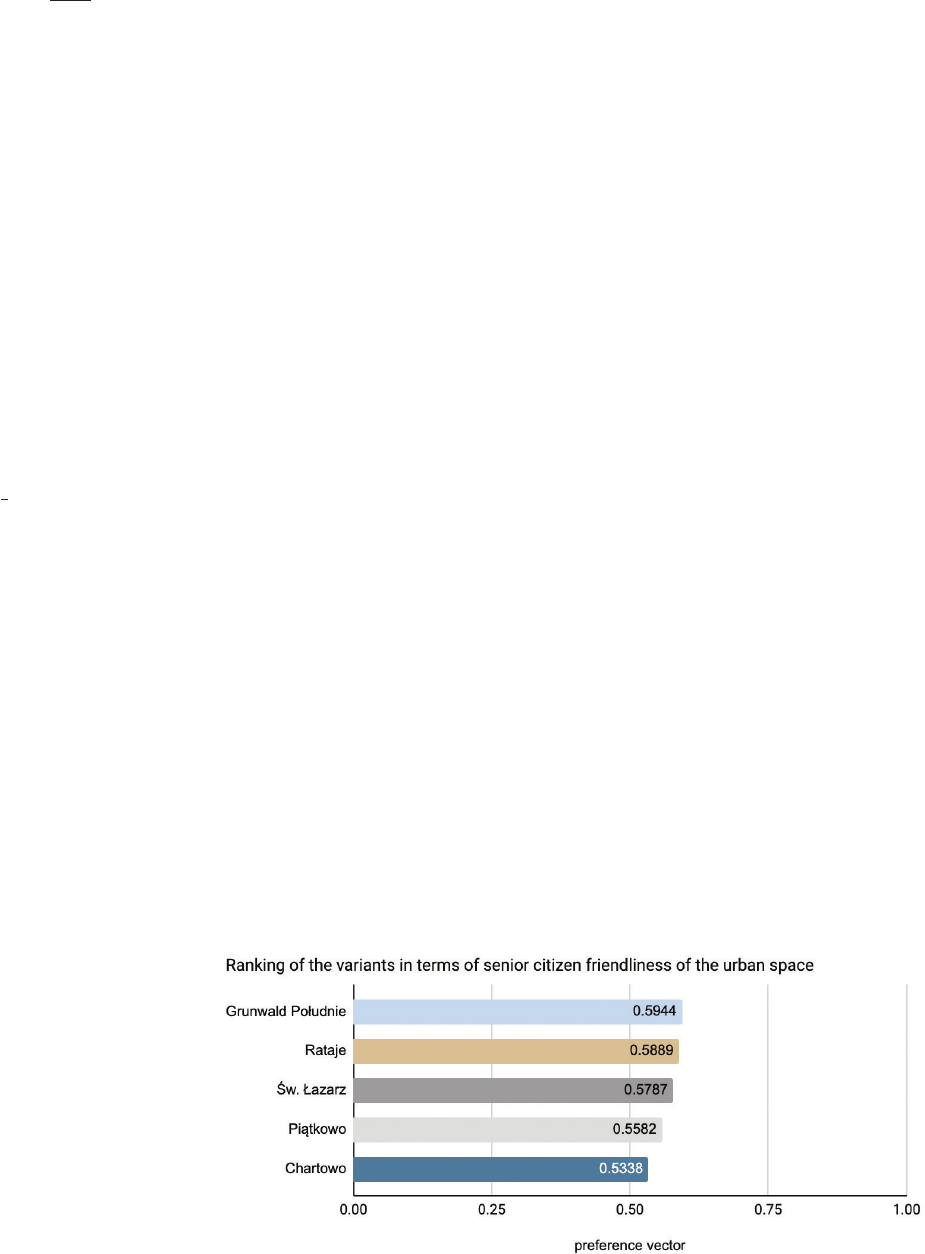
Based on the results obtained during the study of the
eciency of the author’s tool for assessing spatial aspects
aecting the quality of life of seniors, it turned out that the
highest position in the ranking was given to the Grunwald
Południe neighbourhood, and the lowest – to Chartowo
(Fig. 9).
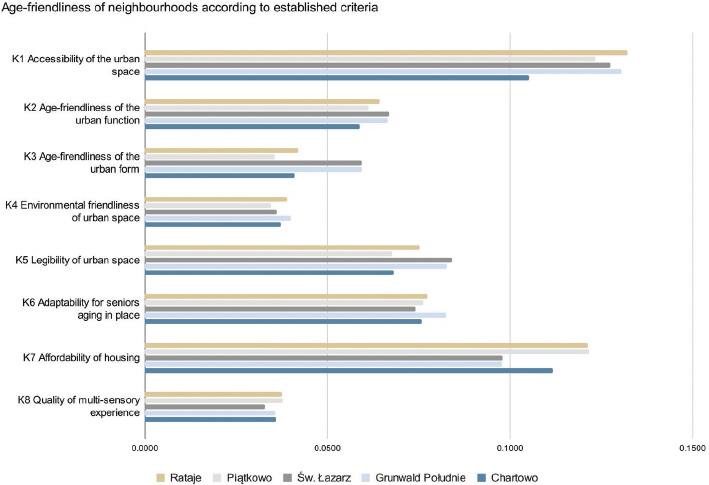
The Grunwald Południe neighbourhood received the
best rating among all the surveyed areas only in terms of
adaptability for seniors aging in place and environmental
friendliness of space. It also scored high in terms of acces-
sibility of space, friendliness of function and urban form,
and legibility of space, which ultimately contributed to
taking rst place in the ranking. But this neighbourhood
fared worst in terms of aordability (cf. Fig. 10).
Conclusions and summary
Based on research, it has been shown that current tools
for assessing urban quality of life are not suciently
adapted to global challenges such as ageing populations,
urbanisation and climate change, and their assessment is
not comprehensive enough. The author’s set of criteria
and sub-criteria proposed in this paper makes it possible
to ll this gap. Current assessment instruments do not take
into account the importance of spatial scale, even though
quality of life can vary within the boundaries of a single
city. The method described in this paper therefore covers
a smaller spatial scale, close to the area of the auxiliary
units – known as neighbourhoods. The research results ob-
tained allowed the research hypothesis to be conrmed.
Signicant results include assigning weight to criteria
according to experts’ opinions, determining the percep-
tual quality of spatial aspects by older people and spatial
quality by experts for ve neighbourhoods in Poznań, and
formulating guidelines for a tool for assessing the spatial
quality of cities, including dening the decision problem
and variants, dening a coherent family of criteria and the
way they are measured, selecting a transparent method,
and verifying eciency through pilot studies. The meth-
od proposed in this article complements existing scientic
tools and models. This is because it makes it possible to
take into account both the global context (universal criteria
created on the basis of international quality of life studies)
and local conditions (measurement of sub-areas instead of
the entire city), and furthermore includes an evaluation of
the quality of space in the expert assessment and the level
of satisfaction with it in the seniors’ perceptual assessment.
Based on the process of verifying the eciency of the
tool, several potential limitations can be diagnosed, such
as: the choice of urban areas of the city (some of the select-
ed areas turned out to be so heterogeneous in their bound-
aries that they made it signicantly dicult for the experts
to assess them reliably), the detail of the questions in the
neighbourhood assessment questionnaire for the experts
(the characterisation of the individual sub-criteria devel-
oped on the basis of indicators from the current assessment
tools analysed earlier turned out to be too general for the
experts), and the fact that the expert surveys were conduct-
ed individually instead of in the form of a group discussion
Fig. 9. Ranking of
neighbourhoods in terms of
the friendliness of architectural
and urban spaces for seniors
(elaborated by
A. Ptak-Wojciechowska)
Il. 9. Ranking osiedli Poznania
pod względem przyjazności
przestrzeni architektoniczno-
-urbanistycznej seniorom
(oprac. A. Ptak-Wojciechowska)
= ∑
̅
=1
Wzory w artykule
=
1
1/
1
1/
1/
1
for , = 1, 2, … ,
=
…
=
=
2.36
9.5912
= 0.2461
=
1
=
1
8
(0.1905 + 0.2461 + 0.2178 + 0.1988 + 0.2002 + 0.2190 + 0.1354 + 0.2016) = 0.2012
=
1
()
CI =
CR =
CI
RI
100%
CI =
(
8.11 8
)
(
8 1
)
0.016
CR =
0.016
1.41
0.01
CR = 0.01 100% = 1%
=
=
96 Agnieszka Ptak-Wojciechowska
Fig. 10. Rankings of
neighbourhoods in terms of their
senior citizen-friendliness
in various aspects (elaborated by
A. Ptak-Wojciechowska)
Il. 10. Rankingi osiedli Poznania
pod względem ich przyjazności
seniorom z uwzględnieniem
poszczególnych aspektów
(oprac. A. Ptak-Wojciechowska)
(due to the interdisciplinary nature and diversity of the
questions, the assessment could have been conducted in
a working group and the result worked out in the form of
a discussion between the experts).
The data obtained from the seniors’ perception survey
not only served to supplement the perception sub-criteria
for the assessment tool under development. The ways in
which they were used and visualised are shown in the dis-
sertation; the statistical analysis and visualisation of the
survey results were performed using Microsoft Excel and
the statistical package Statistica (Ptak-Wojciechowska
2023).
An interesting alternative to statistical testing is articial
intelligence. The author is currently working on the use of
machine learning (decision trees and rules) to analyse the
results obtained from perceptual surveys conducted among
seniors and questionnaire surveys of expert assessment.
Analyses are performed using the WEKA programme,
among others. In addition, research into the quality of life
in cities is being continued through ongoing projects using
data mining. Their aim is to automate the extraction of ob-
jective information from available data sources (e.g., Open
Street Map) to supplement expert and perceptual evalua-
tions. These concern the distance of important functions
from the place of residence of seniors and the location of
small architecture in the context of the needs and mobility
of older people.
Translated by
Agnieszka Ptak-Wojciechowska
Acknowledgements
The described research was carried out as part of the doctoral disserta-
tion conducted under the supervision of Prof. Agata Gawlak.
I would like to thank the Supervisor, the experts who shared their special-
ist knowledge, and all the Seniors involved and their Representatives for
their participation in the research.
References
Abousaeidi, Monammad, and Pantea Hakimian. “Developing a Checklist for
Assessing Urban Design Qualities of Residential Complexes in New
Peripheral Parts of Iranian Cities: A Case Study of Kerman, Iran.” Sustain-
able Cities and Society 60, (2020). https://doi.org/10.1016/j.scs.2020.10225 .
Abusaada, Hisham, and Abeer Elshater. “Urban design assessment tools:
A model for exploring atmospheres and situations.” Urban Design
and Planning 173, no. 6 (2020): 238–55. https://doi.org/10.1680/
jurdp.20.00025.
Afshari, Ali, Mahdi Vatanparast, and Dragan Ćoćkalo. “Application of
multi criteria decision making to urban planning. A review.” Journal
of Engineering Management and Competitiveness 6, no. 1 (2016):
46–53. https://doi.org/10.5937/jemc1601046A.
Bendowska, Marta, Anna Bieńkuńska, Paweł Ciecieląg, Paweł Luty,
Karol Sobesjański, and Joanna Wójcik. “Jakość życia w Polsce.
Edycja 2017.” Główny Urząd Statystyczny, 2017. Accessed May
2023, at https://stat.gov.pl/les/gfx/portalinformacyjny/pl/defaul-
taktualnosci/5486/16/4/1/jakosc_zycia_w_polsce_2017.pdf.
Bentley, Ian, Sue McGlynn, Graham Smith, Alan Alcock, and Paul
Murrain (eds.). Responsive environments: A manual for designers.
MPG Books, 2005.
Björnberg, Arne, and Ann Yung Phang. “Euro Health Consumer Index
2018.” Health Consumer Powerhouse, 2019. Accessed May 2023, at
https://sante.public.lu/dam-assets/fr/publications/e/euro-health-con-
sumer-index-2018/euro-health-consumer-index-2018.pdf.
Use of the Analytic Hierarchy Process (AHP) method to assess the urban quality of life of seniors 97
Blečić, Ivan, Arnaldo Cecchini, Tanja Congiu, Giovanna Fancello, and
Giuseppe Truno. “Evaluating walkability: a capability-wise planning
and design support system.” International Journal of Geographical
Information Science 29, no. 8 (2015): 1350–74. https://doi.org/10.108
0/13658816.2015.1026824.
Błędowski, Piotr, Barbara Szatur-Jaworska, Rafał Bakalarczyk, Paweł
Łu czak, Zoa Szweda-Lewandowska, Maria Zrałek, et al. System
wspar cia osób starszych w środowisku zamieszkania: przegląd
sytua cji, propozycja modelu. Biuro Rzecznika Praw Obywatelskich,
2016.
Brewer, Graham, Lynne Parkinson, Chris Tucker, and Chris Landorf. “So-
cially sustainable suburbia: Linking neighbourhood characteristics
to health outcomes in an ageing population.” International Journal
of Interdisciplinary Social and Community Studies 8, no. 4 (2014):
1–18. https://doi.org/10.18848/2324-7576/CGP/v08i04/53522.
Cabała, Paweł. “Proces analitycznej hierarchizacji w ocenie wariantów
rozwiązań projektowych.” Przedsiębiorstwo we współczesnej gospo-
darce – teoria i praktyka 1 (2018): 23–33. https://doi.org/10.19253/
reme.2018.01.002.
Centrum Badania Opinii Społecznej. “Zadowolenie z życia (Life satisfac-
tion).” Komunikat z badań 2, 2020. Accessed May 2023, at https://
cbos.pl/SPISKOM.POL/2020/K_002_20.PDF.
Cinelli, Marco, Miłosz Kadziński, Grzegorz Miebs, Michael Gonzalez,
and Roman Słowiński. “Recommending Multiple Criteria Decision
Analysis Methods with A New Taxonomy-based Decision Support
System.” arXiv (2021). https://doi.org/10.48550/arXiv.2106.07378.
Costa, Helder Gomes. “AHP-De Borda: A hybrid multicriteria rank-
ing method.” Brazilian Journal of Operations & Production
Management 14, no. 3 (September 2017): 281–87. https://doi.
org/10.14488/BJOPM.2017.v14.n3.a1.
Czapiński Janusz, and Tomasz Panek, eds. Diagnoza społeczna 2015.
Wa runki i jakość życia Polaków. Raport. Rada Monitoringu Spo-
łecz nego, 2015. Accessed May 2023, at www.diagnoza.com/pliki/
raporty/Diagnoza_raport_2015.pdf.
Czepkiewicz, Michał, and Piotr Jankowski. “Analizy przestrzenne w bada-
niach nad jakością życia w miastach.” Ruch Prawniczy, Ekono micz ny
i Socjologiczny 77, no. 1 (2015): 101–17. https://doi.org/10.14746/
rpeis.2015.77.1.6.
Donder, Liesbeth, Tine Buel, Sarah Dury, Nico De Witte, and Dominique
Verté. “Perceptual quality of neighbourhood design and feelings of
unsafety.” Ageing and Society 33, no. 6 (2013): 917–37. https://doi.
org/10.1017/S0144686X12000207.
The Economist Intelligence Unit. The Global Liveability Index 2019.
(2019). Accessed May 2023, at https://www.cbeinternational.ca/pdf/
Liveability-Free-report-2019.pdf.
Esmaeilpoorarabi, Niusha, Tan Yigitcanlar, and Mirko Guaralda.
“Towards an urban quality framework: determining critical measures
for dierent geographical scales to attract and retain talent in cities.”
International Journal of Knowledge-Based Development 7, no. 3
(2016): 290–312. https://doi.org/10.1504/IJKBD.2016.078556.
Eurofound. European Quality of Life Survey 2016: Quality of life, quality
of public services, and quality of society. Publications Oce of the
European Union, 2017. https://doi.org/10.2806/964014.
European Commission. Directorate General for Regional Policy.
Quality of Life in Cities: Perception Survey in 79 European Cities.
Publications Oce, 2013. Accessed May 2023, at https://data.euro-
pa.eu/doi/10.2776/79403.
Eurostat (European Commission). Final Report of the Expert Group on
Quality of Life Indicators: 2017 Edition. Publications Oce of the
European Union, 2017. Accessed May 2023, at https://data.europa.
eu/doi/10.2785/021270.
Federal/Provincial/Territorial Ministers Responsible for Seniors. Age-
friendly rural and remote communities: A guide, 2007. Accessed May
2023, at https://www.phac-aspc.gc.ca/seniors-aines/alt-formats/pdf/
publications/public/healthy-sante/age_friendly_rural/AFRRC_en.pdf.
Feng, I-Ming, Jun-Hong Chen, Bo-Wei Zhu, and Lei Xiong. “Assessment
of and Improvement Strategies for the Housing of Healthy Elderly:
Improving Quality of Life.” Sustainability 10, no. 3 (2018): 722.
https://doi.org/10.3390/su10030722.
Garau, Chiara, and Valentina Maria Pavan. “Evaluating Urban Quality:
Indicators and Assessment Tools for Smart Sustainable Cities.” Sus-
tain ability 10, no. 3 (2018): 575. https://doi.org/10.3390/su10030575.
Garcia, Davide Astiaso, Fabrizio Cumo, Elisa Pennacchia, Valentina Ste-
fanini Pennucci, Giuseppe Piras, V. De Notti, and Rossella Roversi.
“Assessment of a urban sustainability and life quality index for
elderly.” International Journal of Sustainable Development and
Planning 12, no. 5 (2017): 908–21. https://doi.org/10.2495/SDP-
V12-N5-908-921.
Gawlak, Agata, Magda Matuszewska, and Agnieszka Ptak. “Inclusiveness
of Urban Space and Tools for the Assessment of the Quality of Urban
Life. A Critical Approach.” International Journal of Environmental
Research and Public Health 18, no. 9 (2021): 4519. https://doi.
org/10.3390/ijerph18094519.
Giles-Corti, Billie, Anne Vernez-Moudon, Rodrigo Reis, Gavin Turrell,
Andrew L. Dannenberg, Hannah Badland, et al. “City Planning and
Population Health: A Global Challenge.” The Lancet 388, no. 10062
(2016): 2912–24. https://doi.org/10.1016/S0140-6736(16)30066-6.
Główny Urząd Statystyczny. “Jak się żyje osobom starszym w Polsce.”
2012. Accessed May 2023, at https://stat.gov.pl/obszary-tematyczne/
warunki-zycia/dochody-wydatki-i-warunki-zycia-ludnosci/jak-sie-
zyje-osobom-starszym-w-polsce-,8,1.html.
Goepel, Klaus. “Implementation of an Online Software Tool for the
Analytic Hierarchy Process (AHP-OS).” International Journal of
the Analytic Hierarchy Process 10, no. 3 (2018): 469–87. https://doi.
org/10.13033/ijahp.v10i3.590.
Hoornweg, Daniel, Lorraine Sugar, and Claudia Lorena Trejos Gómez.
“Cities and Greenhouse Gas Emissions: Moving Forward.” Environ-
ment and Urbanization 23, no. 1 (2011): 207–27. https://doi.
org/10.1177/0956247810392270.
IMD World Competitiveness Center’s Smart City Observatory, Singapore
University of Technology and Design. “IMD Smart City Index”. The
IMD World Competitiveness Center, 2019. Accessed May 2023, at
https://www.imd.org/research-knowledge/reports/imd-smart-city-in-
dex-2019/.
Kobryń, Andrzej. Wielokryterialne wspomaganie decyzji w gospodaro-
waniu przestrzenią. Din, 2014.
Kubendran, Sindhu, Liana Soll, and Paul Irving. “Best Cities for Successful
Aging 2017.” Milken Institute, 2017. Accessed May 2023, at https://
milkeninstitute.org/reports/best-cities-successful-aging-2017.
Lamura, Giovanni, and Andrea Principi. “2018 Active Ageing Index.
Analytical Report.” UNECE/ European Commission, 2019. Accessed
May 2023, at https://unece.org/population/active-ageing-index.
Lowe, Melanie, Carolyn Whitzman, Hannah Badland, Melanie Davern,
Lu Aye, Dominique Hes, et al. “Planning Healthy, Liveable and
Sustainable Cities: How Can Indicators Inform Policy?” Urban
Policy and Research 33, no. 2 (2015): 131–44. https://doi.org/doi:
10.1080/08111146.2014.1002606.
Maleki, Saeid, Simon Bell, Seyedbagher Hosseini, Mohsen Faizi.
“Developing and testing a framework for the assessment of neigh-
bourhood liveability in two contrasting countries: Iran and Estonia.”
Ecological Indicators 48 (2015): 263–71. https://doi.org/10.1016/j.
ecolind.2014.07.033.
Mathew, Manoj, Sahar Sahu, and Ashis Kumar Upadhyay. “Eect of
Nor malization Techniques in Robot Selection Using Weighted
Aggre gated Sum Product Assessment.” International Journal of
Inno vative Research and Advanced Studies 4, no. 2 (2017): 59–63.
Mercer. “Quality of living – location reports.” 2019. Accessed May 2023,
at https://mobilityexchange.mercer.com/Insights/quality-of-liv-
ing-rankings.
Miller, George A. “The magical number seven, plus or minus two: Some
limits on our capacity for processing information.” Psychological
Review 63 (1956): 81–97. https://doi.org/10.1037/h0043158.
Monocle. Quality of Life Survey, 2019. Accessed May 2023, at https://
monocle.com/lm/aairs/quality-of-life-survey-top-25-cities-2019/.
Okulicz-Kozaryn, Adam. “City Life: Rankings (Livability) Versus
Perceptions (Satisfaction).” Social Indicators Research 110 (2013):
433–51. https://doi.org/10.1007/s11205-011-9939-x.
Oppio, Alessandra, Marta Bottero, and Andrea Arcidiacono. “Assessing
urban quality: a proposal for a MCDA evaluation framework.”
Annals of Operations Research 312 (2022): 1427–44. https://doi.
org/10.1007/s10479-017-2738-2.
Oppio, Alessandra, Luca Forestiero, Loris Sciacchitano, and Marta
Dell’Ovo. “How to assess urban quality: a spatial multicriteria
decision analysis approach [Come valutare la qualità urbana: un
98 Agnieszka Ptak-Wojciechowska
approccio di analisi decisionale spaziale multi-criteriale per gli spazi
aperti pubblici].” Valori e Valutazioni 28 (2021): 21–30. https://doi.
org/10.48264/VVSIEV-20212803.
Organisation for Economic Cooperation and Development. “How’s Life?
2020: Measuring Well-being.” 2020. https://doi.org/10.1787/9870c-
393-en.
Polityka and Akademia Górniczo-Hutnicza. “Ranking jakości życia.
Wymiary szczęścia (Quality of life ranking. Dimensions of happi-
ness).” 2018. Accessed May 2023, at https://prod-zmp.s3.pl-waw.
scw.cloud/uploads/attachment/file/2367/RANKING_MIAST-
Polityka.pdf?X-Amz-Expires=600&X-Amz-Date=20241028T1
03504Z&X-Amz-Algorithm=AWS4-HMAC-SHA256&X-Amz-
Credential=SCWNS07DYNDXX7TN9XNZ%2F20241028%2F-
pl-waw%2Fs3%2Faws4_request&X-Amz-SignedHeaders= host -
&X- Amz-Signature=1d3f4e4017819275e26dbfa1b9fc78ca47c589
5e2da9da16f24b5688531712e4.
Pörtner, Hans-Otto, Debra Cynthia Roberts, Melinda M.B. Tignor, Elvira S.
Poloczanska, Katja Mintenbeck, Andrès Alegría, et al., eds. “Climate
Change 2022: Impacts, Adaptation and Vulnerability. Contribution
of Working Group II to the Sixth Assessment Report of the Inter-
governmental Panel on Climate Change.” Cambridge University
Press, 2022. Accessed May 2023, at https://www.ipcc.ch/report/ar6/
wg2/downloads/report/IPCC_AR6_WGII_FrontMatter.pdf.
Ptak-Wojciechowska, Agnieszka. “Analiza wybranych narzędzi do ewa-
luacji jakości życia w mieście w kontekście zmian społeczno-demo-
gracznych.” PhD thesis, Politechnika Poznańska, 2023.
Reid, Jim, Craig Nicol, and Henry Allen. “Mapping the World’s Prices
2019. Thematic Research.” Deutsche Bank AG, 2019. Accessed
May 2023, at https://www.dbresearch.com/PROD/RPS_EN-PROD
/ PROD0000000000494405/Mapping_the_world%27s_pric-
es_2019.pdf?undefined&realload=3Chhg5~gLR7mqW1YPu6b/
QkVW2dz2c3l8UwI3sIOswl8TPRB07K7FDIulbgAewd~.
Rokicka, Ewa (red.). Jakość życia mieszkańców Łodzi i jej przestrzenne
zróżnicowanie. Wydawnictwo Uniwersytetu Łódzkiego, 2013.
Saaty, Thomas L. “Absolute and Relative Measurement with the AHP.
The Most Livable Cities in the United States.” Socio-Eco no mic
Planning Sciences 20, no. 6 (1986): 327–31. https://doi.org/ 10.1016/
0038-0121(86)90043-1.
Stefanów, Piotr, and Anna Prusak. “Badania nad właściwościami opera-
cyjnymi metody AHP”. Folia Oeconomica Cracoviensia 52 (2011):
87–104.
Trzaskalik, Tadeusz. “Wielokryterialne wspomaganie decyzji. Przegląd
metod i zastosowań.” Zeszyty Naukowe Politechniki Śląskiej.
Organizacja i Zarządzanie 74 (2014): 239–63.
United Nations. Department of Economic and Social Aairs, Population
Division. “World Population Prospects 2020.” Accessed May 2023,
at https://population.un.org/wpp/
United Nations. Department of Economic and Social Aairs. “World
Population Prospects 2022: Summary of Results.” 2022. Accessed
May 2023, at https://www.un.org/development/desa/pd/content/
World-Population-Prospects-2022.
United Nations Development Programme. “Human Development Report
2019. Beyond income, beyond averages, beyond today: Inequalities in
human development in the 21
st
century.” 2019. Accessed May 2023,
at https://hdr.undp.org/content/human-development-report-2019.
Vitman Schorr, Adi, and Rabia Khalaila. “Aging in Place and Quality of
Life among the Elderly in Europe: A Moderated Mediation Model.”
Archives of Gerontology and Geriatrics 77 (2018): 196–204. https://
doi.org/10.1016/j.archger.2018.04.009.
Wałachowski, Karol, and Sebastian Król. Uciekające metropolie.
Ranking 100 polskich miast. Klub Jagielloński, 2019. Accessed May
2023, at https://klubjagiellonski.pl/publikacje/uciekajace-metropo-
lie-ranking-100-polskich-miast/.
Wojnarowska, Anna. “Model for Assessment of Public Space Quality
in Town Centers.” European Spatial Research and Policy 23, no. 1
(2016): 81–109. https://doi.org/10.1515/esrp-2016-0005.
World Health Organization. “Global Age-Friendly Cities: A Guide.”
2007. Accessed May 2023, at https://iris.who.int/bitstream/han-
dle/10665/43755/9789241547307_eng.pdf?sequence=1.
World Health Organisation. “Measuring the age-friendliness of cities:
a guide to using core indicators.” 2015. Accessed May 2023, at http://
www.who.int/ageing/publications/measuring-cities-age-friendli-
ness/en/.
Yigitcanlar, Tan, Md. Kamruzzaman, and Suharto Teriman. “Neigh bor -
hood Sustainability Assessment: Evaluating Residential De ve lop -
ment Sustainability in a Developing Country Context.” Sus tain ability
7, no. 3 (2015): 2570–602. https://doi.org/10.3390/su7032570.
Zavadskas, Edmundas Kazimieras, Tatjana Vilutienė, Zenonas Turskis,
and Jonas Šaparauskas. “Multi-Criteria Analysis of Projects’ Per-
for mance in Construction.” Archives of Civil and Mechanical
En gineer ing 14, no. 1 (2014): 114–21. https://doi.org/10.1016/j.
acme.2013.07.006.
Streszczenie
Wykorzystanie metody Analytic Hierarchy Process (AHP) do oceny jakości życia osób starszych w miastach
pod względem aspektów architektoniczno-urbanistycznych
Miasta powinny zapewniać wysoką jakość życia wszystkim mieszkańcom. Mimo zachodzących zmian demogracznych tkanka urbanistyczna
odpowiada w sposób niewystarczający na potrzeby przestrzenne seniorów. Brakuje ponadto naukowych instrumentów oceny, które mogłyby posłu-
żyć za wsparcie w ocenie aspektów architektoniczno-urbanistycznych miasta, a w konsekwencji także w ich poprawie. Chociaż popularne rankingi
miejskie mogą być wykorzystywane w rozwoju polityki miejskiej, ich wyniki są często nieprawidłowo interpretowane przez odbiorców. Zastosowanie
metod wielokryterialnego wspomagania decyzji może ułatwić proces porównywania obszarów miasta, zwiększyć transparentność ewaluacji oraz
zaangażować różnych interesariuszy w proces oceny. Uczenie maszynowe natomiast może stanowić interesujące rozszerzenie dla stosowanych po-
wszechnie metod statystycznych. W artykule zaprezentowano najnowsze metody w badaniach nad miejską jakością życia seniorów na przykładzie
wielokryterialnej analizy pięciu osiedli miasta Poznania. Omówiono wykorzystanie metody analytic hierarchy process (AHP) jako części autorskiego
narzędzia do oceny percepcyjnej przez starszych mieszkańców, a także oceny eksperckiej przez architektów i urbanistów pod względem aspektów
funkcjonalno-przestrzennych. Dowiedziono skuteczności metody AHP – rezultaty mogą stanowić wsparcie dla władz miasta, projektantów i badaczy.
Przedstawiono ponadto kierunki rozwoju niniejszych badań z zastosowaniem metod uczenia maszynowego.
Słowa kluczowe: metody partycypacyjne, metody wielokryterialne, jakość życia w miastach, uczelnie maszynowe, starzejące się społeczeństwo